
TESTING THE SURVIVAL MODEL: DOES SUKUK OFFER A BETTER
TRADE-OFF?
Roslina Mohamad Shafi1, Sharifah Raihan Syed Mohd Zain2, Mohamed Eskandar Shah Mohd Rasid3, Ahamed Kameel Mydin Meera2
Department of Finance, Faculty of Business and Management, Universiti Teknologi MARA Johor, Malaysia1; Department of Finance, Kulliyyah of Economics and
Management Sciences, International Islamic University Malaysia2; INCEIF, The
Global University of Islamic Finance, Malaysia3.
Corresponding email: [email protected] / [email protected]
Abstract
The theory of capital structure claims that the optimal amount of debt and equity offer trade-off benefits due to the cost and benefit effect. However, the fact yet remains puzzled whether sukuk companies will have the same effect because sukuk possess both debt and equity characteristics. We argue that firm which enjoys the trade-off benefits could survive longer. Consequently, the central aim of this study is to examine the survival time of sukuk and bond companies before the occurrence of the financial distress. The results revealed no difference between the survival time of sukuk and bonds companies, which indicate that both of these companies have a similar lifetime, hence similar trade-off benefits. Cox regression has been conducted to identify the predictors that influence the survival time. Interestingly, the results show that liquidity ratio, measured by operating cash flow to current liability (OCFCL), is the most significant predictor in the case of sukuk. Contrary to the expectations, none of the predictors tested are significant for bonds. These results suggest a new understanding that even though the trade-off benefits and survival time i
1. INTRODUCTION
In order to fulfill the financial needs of the company, the management usually opt for bonds issuance over equity because bonds offer trade-off benefits. The trade-off benefit is a compromise between costs of bonds issuance and the tax advantage. The costs of bonds issuance are bankruptcy cost, agency cost and loss of future flexibility. Besides tax advantage, investors also view bonds company as more stable company because it shows the management commitment in servicing the debt. Nevertheless, there is a limit in issuing bonds and the company must observe their debt ratios. Higher amount of debts increases the probability of financial distress (Warner, 1977). In the worst scenario, a company might file for bankruptcy, or the company can be acquired or taken over by other company.
Apart of bonds, a company can also tap their financial resources through the sukuk issuance. Sukuk has been defined clearly by the Securities Commission (SC) of Malaysia, as the following:
“Certificates of equal value which evidence undivided ownership or investment in the assets using Shariah principles and concepts endorsed by the Shariah Advisory Council (SAC), but shall not include any agreement for a financing/investment where the financier/investor and customer/investee are signatories to the agreement and where the financing/investment of money is in the ordinary course of business of the financier/investor, and any promissory note issued under the terms of such an agreement” (Guidelines on the Offering Islamic Securities 2012, pp.9). Sukuk issuance requires an underlying asset, which backs sukuk issuance where returns of sukuk are dependent on the performance of assets. Unlike returns on bonds, which are based on the interest rate; returns on sukuk are a volatile subject to the price of the underlying assets. However, in the case of critical price volatility, a company can exercise a top-up mechanism1 to ensure a smooth periodic distribution to the investors. Sukuk holders have ownership rights on the cash flow of the specific underlying asset. The bondholders have rights only for return on investment, unlike the bonds structure which is based on the concept of interest rates. Besides, bondholders are credit lenders with no ownership possession of the company. Scholars argue that sukuk and bonds are two different financial securities because sukuk is an equity-based financial instrument and thus sukuk are not bonds (Ariff & Safari, 2012; Dusuki & Mokhtar 2010; Lahsasna & Lin, 2012).
According to theory of conventional finance, a company may possess a trade-off benefits when issuing bonds. We argue that the firm whih enjoy the trade-off benefits of bonds issuance could survive longer and possess healthier financial performance than a company that issuing equity (stock)2. However, a question arises whether sukuk issuance could provide a better trade-off as compared to bonds issuance. A company issuing sukuk is exposed to additional risk in comparison to the one issuing bonds. This includes the risk of underlying assets’ price, foreign exchange risk and liquidity risk. Hence, sukuk companies also expose to the probability of financial distress. Currently, there are around 18 cases of distressed sukuk companies in Malaysia and 12 cases of distressed bonds companies3.
1.1 Statement of Problem
Issuing bonds increases the probability of financial distress despite the expectation that it could provide financial assistance to the company. Costs of debt (bond) issuance are more expensive than issuing equity. Regardless of this, a company must have a strong disbursement system to pay returns to the bondholders on priority. In the case of bankruptcy, the bonds must be liquidated and bondholders possess the first right of claimant. It is unknown whether company could survive longer after issuing a bond because there are cases where bonds companies also faced financial distress problem. In addition, there is also lack of evidence to associate the theory of trade-off to sukuk issuance. Even though, sukuk is regarded as similar to bonds, yet sukuk possess both equity and debt characteristics that makes it as a unique financial security. Besides, sukuk is a profit and loss sharing financial instrument between the company and the sukuk holders, while bonds are based on the pure creditor-borrower relationship. Consequently, sukuk companies may have different risk exposure and this may suggest a different probability of financial distress as compared to bonds. It is important to identify whether the company could survive once sukuk and bonds have been issued and how long is the survival time. In addition, we argue that due to different characteristic of sukuk and bonds, the determinants of the survival time might also be different.
1.2 Objectives of the Study
The study aims to investigate the following objectives:
i. To identify the survival time of sukuk and bonds companies before the occurrence of actual financial distress.
ii. To recognize the factors contributing towards the survival time of sukuk and bonds companies.
1.3 Significance of the Study
This research is vital to be carried out because sukuk has emerged as one of the major financial sources among the corporate companies. Companies are suggested to adhere to the optimal capital structure where the proportion of equity and debt should be well adjusted. The effect of sukuk issuance on the capital structure is ambiguous because of its unique characteristics. The present day is the best time to initiate this study due to the growing number of sukuk issuance (asset-based) and the increasing number of financial distress cases among sukuk companies in Malaysia (Shahida & Sapiyi, 2013).
In the field of medicine, a patient that has been diagnosed with a particular disease will be given a special medical treatment, and will be observed for the health condition; as to either it is improving or deteriorating. Similarly, company that issued sukuk or bonds usually are short in liquidity. Sufficient liquidity is needed; hence bonds were issued as a remedy to ensure smooth operating and continuity of the business. Accordingly, once the company has issued either sukuk or bonds, the management needs to monitor the financial performance of the company. It is important to identify whether the company can survive once the capital is injected through the sukuk or bonds issuance. In other words, a company undergoes financial restructuring by having sukuk and bonds in their capital structure. Changes in the capital structure should be monitored because it affects the company’s survival and later may lead to the problem of financial distress. Hence, the investigation is crucial and this has motivates the study to investigate the factors that contribute to the survival time.
More importantly, outcomes of this study will offer evidence on the applicability of the theory of capital structure and trade-off theory from an Islamic perspective, particularly in the sukuk issuance. Findings of this study should provide a new understanding on the characteristics of sukuk companies and perhaps can be used to outline a new policy in the sukuk issuance.
This study is divided into five sections. The next section, Section 2 will discuss about the related literature review. It then followed by Section 3, which cover the data and methodology. Section 4 will discuss the findings of the study. Section 5 discusses the implication and then concludes.
2. LITERATURE REVIEW
In conventional finance, capital structure theories have been well-developed theoretically and empirically over the years. It constitutes many theories such as trade off theory (Modigliani & Miller, 1958 cited in Banos-Caballero et al., 2014), irrelevance theory (Myers and Majluf, 1984 cited in Naranjo et al., 2013), pecking order theory (Jensen & Meckling, 1977; cited in Lim, 2012), agency theory and bankruptcy cost of debt theory (Warner, 1977; cited in Elkamhi et al., 2012). However, the most relevant theory of this study is the existing trade-off theory. This theory asserts that the company is able to increase its value due to interest tax advantage, but has disadvantage of balancing the potential costs of financial distress. Nevertheless, sukuk have different characteristics and hence, applicability of the trade-off theory in sukuk is remain perplex. There is lack of empirical research conducted using sukuk sample, majority of the studies concentrate on the yield of sukuk (Cakir & Raei, 2007; Safari, Ariff & Shamsher, 2013; Ariff & Safari, 2012), rating changes, sukuk defaults (Majid, Shahimi & Abdullah, 2011) and determinants of sukuk issuance (Haniffa, Masih & Batcha, 2014; Nagano, 2013). Yet, conceptual studies on sukuk are abundance.
Many previous studies have provide an empirical evidence on financial distress and various bankruptcy prediction models has been proposed. Altman has pioneered a study on bankruptcy in the year of 1968. Since then, many contemporary studies have replicating Altman model and trying to formulate the best model to predict the financial distress. As per the fact, the study still lacks in distinguishing the influence of the conventional and Islamic debts on the costs of financial distress. This study believe that there must be a different impact on survival time that is unidentified by the researches. This is because in Islam every financial product must be in line with the shariah principles (i.e. prohibition of riba). These principles are backed by solid reasons (i.e. prohibition of riba prevent poor becomes poorer) with the confidence that it will bring maslahah (benefit) to the society. Consequently, we argue that sukuk also provide benefits to the company. However, very little works has been conducted to distinguish the effect of sukuk and bonds on the financial distress and its survival time. The research has yet to reach the level where these matters can be proven statistically. There were mixed agreement on the determinants used to predict the financial distress4 and bankruptcy. Besides, there are debates that statistical techniques are more important than the predictors itself. In the field of financial distress, there are three financial distress models that have been applied extensively by the researchers. These models include Altman Z-score model (1968), Ohlson model (1980) and Shumway model (2000), whereas Altman Z-score model is using the MDA technique (cited in Altman et al., 2014)5. The model was first developed using 22 initial variables and subjected to five ratio categories; namely, liquidity, leverage, activity, solvency, and profitability ratios6. The final ratios produced by the model are working capital to total assets (WCTA), retained earnings to total assets (RETA), earnings before interest and tax to total assets (EBIT/TA), market value of equity to book value of total liabilities (MVE/BVTL) and sales to total assets (S/TA).
Many researchers have identified diverse findings on the importance of the Altman’s variables. Begley7 et al. (1997; cited in Grice & Dugan, 2003) used 1980s samples and identified WCTA as the most important variable, while S/TA as the least important8. On the other hand, Grice & Ingram (2001)9 identified different coefficient power than the Altman’s original model, which suggests that the model is not stationary. RETA 4 Terminology of hazard is used interchangeably with financial distress. Survival and financial distress/hazard have an inverse relationship. The higher the survival rate, the lower the financial distress/hazard probability. and EBIT/TA show higher F-test significance level in 1985-1987 samples10 than in the Altman’s original model. Similar to Begley et al. (1997), MVE/BVTL exhibit lower significance as compared to the Altman’s model. However, WCTA and S/TA recorded similar significance as in the Altman model. In contrast, Chava & Jarrow (2004) 11 and Bandyopadhyay (2006) 12 demonstrated that WCTA, EBIT/TA, MVE/BVTL, and S/TA are significant. However, Chava & Jarrow (2004) identified negative coefficient sign and Bandyopadhyay (2006) identified positive coefficient sign.
The second most popular model is the Ohlson (1980; Hill et al., 2011) model developed using logit regression for a bankruptcy data set from the year 1970 until year 1976. Ohlson combined the use of ratios from various notable studies based on simplicity reason. The model contains nine variables; namely, SIZE, total liability to total assets (TLTA), working capital to total assets (WCTA), current liabilities to current asset (CLCA), binary variable: one if total liabilities exceed total assets, zero otherwise (OENEG), net income to total assets (NITA), funds provided by operations divided by total liabilities (FUTL), binary variable: one if net income was negative for the last two years, zero otherwise (INTWO) and change in net income (CHIN). Ohlson identified SIZE as the most important variable in predicting bankruptcy, followed by TLTA. In addition to that, combination of performance measure, NITA level.
bankruptcy. and/or FUTL, and liquidity measure such as WCTA, or WCTA and CLCA are also significant in assessing bankruptcy.
Among the researcher that tested the Ohlson original model is Hillegeist et al. (2004), who applied the industrial bankruptcy sample 13. All variables tested produced significant coefficient, but different coefficient signs as compare to Ohlson original model14. Only CLCA is not significant and it demonstrates negative coefficient sign. Wu et al. (2010) compared the performance of financial distress models using US companies which covers the period of 1980 to 2006. Out of nine Ohlson’s variables, only CHIN, WCTA, INTWO, TLTA and SIZE are significant. More recently is study by Kordlar & Nikbakht (2011) who is using sample from Tehran Stock Exchange from the year of 2001-2009. Only two Ohlson variables are identified as significant; namely, TLTA and OENEG (Low et al., 2001). Liquidity, profitability and financial leverage are identified to be the most important variables for logit technique (Sulaiman et al., 2001).
The third model is the hazard model, which is also known as the survival model and the Cox regression. It has become popular in the financial distress studies, after its first introduction by Shumway (2001). Shumway developed this model using accounting variables applied earlier by Altman (1968 cited in Altman et al., 2014) and prediction models. Zmijewski15 (1984; cited in Lam & Trinkle, 2014). He also added market predictors including the size of market, past returns of stock and the stock returns’ idiosyncratic standard deviation. Shumway identified that the hazard model is more powerful when market variables are added. Shumway suggested the size of market, past returns of stock and the stock returns’ idiosyncratic standard deviation, NITA and TLTA. Chancharat (2008) and Spaliara & Tsoukas (2013) employed Cox proportional hazard and discovered that companies associated with high leverage, lower past excess returns and larger size can be classified as financial distress companies. Surviving companies are found to be less indebted, more profitable and possess more collateral for external financing than the failed companies. Hazard model is suggested due to capacity to adjust the financial distress risks automatically by not detecting a particular company as a sample; when the company’s financial position is deteriorated due to bankruptcy or any other distress events i.e. defaults, acquisitions. Moreover, hazard model incorporates annual observation as time-varying covariates which mean it is considering the independent variables characteristics that change over time (Polemis & Gounopoulos, 2012). It can also produce higher accuracy prediction within the out of sample forecasts. Besides, the situation is similar to logit model that can include each company’s year as independent observation.
In reference to various past studies, researchers applying data extraction using the balance sheet and income statement. Yet, there was transition in the study where data from cash flow has received more attention because the data is more current than balance sheet and income statement, which is historical. Returns on sukuk are very much related to its cash flow management. Even though there are claims that most of the sukuk issuance imitates the cash flow of the conventional bonds (Godlewski et al., 2011; Wilson, 2008), yet sukuk is different because its cash flow is depending on the performance of the underlying assets’ value. Cash flow is crucial in sukuk issuing; it indicates the importance of cash position for sukuk companies.
The use of cash flow-based variables as predictors is not new in financial distress studies, due to which researches emphasize on the fact that “cash is the king”. Beaver (1966 cited in Hill et al., 2011) has pioneered the application of cash flow in his failure prediction model and revealed the best variable; cash flow to total debt encounted to be the most important variable. Figlewicz and Zeller (1991 cited in Bhandari & Iyer, 2013) and Mills and Yamamura (1998; cited in Lakshan & Wijekoon, 2014) suggested that firm’s ability can be assessed through the operating cash flow divided by current liabilities (OCF/CL). In addition, Carslaw and Mills (1991; cited in Dumont & Schmit, 2014), Figlewicz and Zeller (1991) and Mills and Yamamura (1998) recommended to use cash flow coverage of interest (OCF+ interest+ tax/long term interest) to measure the strength of the firm financially. Besides, the margin of operating cash flow is also a meaningful predictor, whereby this ratio is able to show how sales can be translated into cash. To measure how cash can be generated from the assets, operating cash flow return to total assets (OCF/TA) can be used. Replacing net income with OCF in the numerator is proven as more precise (Figlewicz and Zeller, 1991). Rizzi (1994; cited in Caballo, 2013) proposed cash flow coverage ratio as a measure for default risk. He claimed that this measurement is suitable because debt is serviced using internal free cash flow where assumption has been made that cash flow, debt servicing and paying capacity is interrelated to financial distress. Gentry et al. (1985; cited in Mohan & Mohan, 2015) discovered that operating cash flow is not significant, but dividend component is important for the cash flow variables. Aziz et al (1988; cited in Mannasoo & Maripuu, 2015) revealed that cash tax paid is mainly the significant predictor followed by operating cash flow. On the other hand, Dambolena & Shulmen (1988; cited in Nimalathasan & Priya, 2013) reworked Altman’s and Getry et al’s model by adding the funds flow ratio. Both of the models were improved where Getry’s model showed a superior performance than the Altman’s.
More recently, Bhandari & Iyer (2013) predicted business failure in the US using cash flow ratios based measure. Discriminant analysis was employed and the model is able to produce 83 percent of correct prediction. Bhandari & Iyer believes that cash and earning is important in business, where lack of both might result in default and consequently bankruptcy problem. For that OCF is recommended in developing the financial distress prediction model. The cash flow variables are, operating cash flow divided by current liabilities (OCF/CL), cash flow coverage of interest (OCF + INT + Tax/INT), operating cash flow margin (OCF/Sales), operating cash flow return on total assets (OCF/Asset), earning quality (EBIT/OCF), quick ratio or acid-test ratio (CA-INV)/CL and three-year sales growth (Sales 3 Yr CAGR).
Synthesizing the above literatures, it shows that understandings on the capital structure theories remain incomplete, especially with respect to sukuk. A question arises whether sukuk issuance will bring the same effect as the other types of debt issuance as claimed by the trade-off theory. Company issuing bonds probably will experience financial distress in the future. This is due to the characteristic of bonds, which is purely debt. However, there is a lack of evidence to support that sukuk companies are also exposing to the same probability of distress.
3. DATA AND METHODOLOGY
The samples in this study consist of asset-based sukuk companies and bonds companies in Malaysia; of which financial distress event were taking place between the years of 2000 until 2013. Data is collected from the Bloomberg, Islamic Finance Information Service (IFIS), Rating Agency Malaysia (RAM), Malaysia Rating Corporation Berhad (MARC), Bursa Malaysia and Securities Commission (SC) of Malaysia. The sample must fulfill any of the following criteria:
i. Companies that fall under PN4, PN17 and Amended PN17 status as stipulated by the Bursa Malaysia, ii. Companies that were delisted from the Bursa Malaysia (but do not file for bankruptcy),
Companies where their sukuk or bonds credit rating 16 was downgraded iii.
subsequently by leading credit rating agencies in Malaysia namely RAM and MARC, iv. Companies where their sukuk or bonds are defaulted or structured, v. Companies that experience a negative profit for two consecutive years, and vi. Companies must not be listed under the finance or banking sector.
The total sample is 36 for sukuk companies and 24 for bonds companies. This sample limitation is notified in this research. However, it is emphasized that all data and grade. information has been taken into consideration to the best of effort. Some of the companies suffer data missing and this is regarded as normal because it is an indicator of failure (Sobehart and Stein, 2000).
The distressed sample in this study requires a matched sample of non-distressed companies. The matched sample17 is selected based on the closest market size from the same industry. The sample is matched using the same industry to eliminate the industry’s effect and to ensure that the conclusion drawn is correct. Distinctive occurrences among the industries and these will prevent comparison to be made from different industries (Beaver, 1966; cited in Hill et al., 2011). Procedures to select non-distress companies are adopted based on Abdullah et al., (2008), Altman (1968), Bandyopadhyay (2006; cited in Korol et al., 2013), Beaver (1966) and Blum (1974; cited in Chen, 2011) which fulfilled the following criteria:
i. Distressed companies were matched with the non-distressed companies by using the same industry as determined by the Bursa Malaysia, ii. Distressed companies were matched with the non-distressed companies, according to the closest market size based on the same year of financial reporting.
The predictors (variables) of this study were selected based on Altman (1968), Ohlson (1980), and Shumway (2001), as well as cash flow variables following Bhandari & Iyer (2013). Stepwise logit regression is conducted and resulted in final predictors as follow:
i. SIZE: log (total assets / GNP price-level index)
ii. STDEV: standard deviation measured by iii. WCTA: working capital to total assets iv. TLTA: total liabilities to total assets v. OCFCL: operating cash flow to current liabilities vi. OCFTA: operating cash flow to total assets vii. OCF Sales: operating cash flow to total sales viii. EBITOCF: earnings before interest and tax to operating cash flow
There are two interrelated statistical techniques that will be applied in this study. The first is the Kaplan-Meier Survival (KMS) and the second is the cox regression, or also known as hazard regression. KMS estimates is conducted prior to hazard analysis. In KMS, event of financial distress after the issuing of sukuk and bonds are measured using two groups. The groups are sukuk companies (group 1) and bonds companies (group 2) groups. The KMS is important because it is able to identify whether there is any significant difference in the survival time between sukuk and bonds companies. Survival time is defined as starting time of issuing sukuk or bonds until the distress time and this is representing as event (1). However, if the company experienced any other events such as early redemption of sukuk / bonds, mergers or any other causes that is not the interest of this study, then the company is considered as ‘censored’ and is represent as non-event (0). KMS produced survival plots, which shows the log hazard versus the log time indicating how survival rate declines with time. In KMS, an assumption must be fulfilled that the censoring is similar between the groups tested; meaning that the number of censorship and the pattern of censorship per group must be similar. A big difference in the number of censoring between the groups will lead to bias. Cox regression is used as a statistical technique in order to identify the hazard/ survival functions.
In Cox, there are no assumptions on the shape of the hazard functions, yet it is based on the assumption on how the covariates (predictors) affect the hazard functions18. Unlike logit model that is static, hazard is used to model the duration of time; for that hazard model is known as a dynamic model. The higher the survival rate indicates the lower the hazard rate, and the other way around.
The following proportional hazard model will be conducted: Ø i,t = e α (t) + βX i,t 1 + e α (t) + βX i,t (1) Where: Ø i,t = represents hazard function X = used in forecasting failure, vector of explanatory variables α (t) = time-varying covariates β = coefficient vector
In the hazard model, a company will be classified as one (1) if it fails at a given time t and else zero (0). For instance, if the firm has been operating for five years and categorized as PN17 by Bursa Malaysia in year five, only year five will have value of one (1), and the rest of the four year will be indicated as zero (0).
4. FINDINGS AND DISCUSSION
In KMS, an assumption must be fulfilled that censoring is similar between the groups tested. A big difference in number of censoring between the groups will lead to bias. The censoring is demonstrates in the Table 1 below.
| Group | Total N | N of Events | N | Percent |
|---|---|---|---|---|
| 1 | 35 | 18 | 17 | 48.6 |
| 2 | 23 | 11 | 12 | 52.2 |
| Overall | 58 | 29 | 29 | 50 |
Overall 58 29 29 50 Note: Group 1 is sukuk and Group 2 is bonds.
Table 1 shows the censored cases for group 1 (sukuk) and group 2 (bonds) is similar where the percentages are 48.6 percent (17 cases) and 52.2 percent (12 cases), respectively. The similar number of censored between sukuk and bonds allowed for further analysis in KMS. Firstly, there is a need to test the hypothesis; significant difference is not identified for the survival times between group 1 and group 2. To address this matter, a comparison using the test statistic of Log rank, Beslow and Tarone-Ware is used.
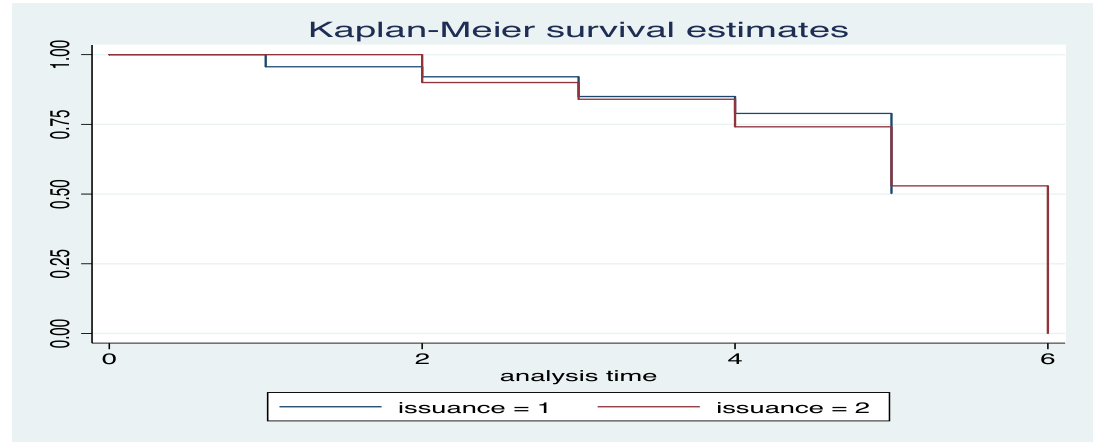
Tarone-Ware 0.137 0.711 Table 2 demonstrates three statistical tests of Log rank, Beslow and Tarone-Ware. The p-value (sig.) is representing the probability to get a test statistic (chi-square). The p-value for all three tests is greater than p > 0.05, which signifies that there is no significant difference of survival time between sukuk and bonds companies. In other words, the time to distress is similar regardless whether the company is issuing sukuk or bonds. The estimated time until distress for sukuk is 4.769 and for bonds is 5.180 which indicate that bonds have slightly longer chances of survival. The result is supported by the plot of cumulative survival functions, which shows how survival times are similar between sukuk and bonds groups. The higher the event of distress occurs, the lower the cumulative survival proportion and the lower the survival curve. For that, a survival curve, which is above or located at the most upper right is considered as better. Figure 1 demonstrates the curve for group 1 and group 2, where both of the curves are crossing each other. This signifies that the two groups are having similar survival time. In addition to that, Figure 1 also shows that the survival curve for both sukuk and bonds are in proportion over time, which implies that the effect of risk factor is constant over time. However, survival rate is only meant for testing survival time, hence to identify the factors that influence the survival time, Cox regression or hazard model needs to be conducted. Cox regression allows exploring the effect of different independent variables on the survival time. Simple Cox regression is conducted on sukuk sample and bonds sample separately. Cox assumed that shape of hazard function is unknown. Cox has been used for testing the effect of the variables upon the specified time an event takes place. Predictor that is identified as significant in the previous stepwise regression is used in the Cox model. To develop the model, hazard function h (t) will be modeled and it can be calculated from survival function. Below equation explains why Cox regression is considered as semi-parametric model:
| Chi-square | df | Sig. | |
|---|---|---|---|
| Log Rank (Mantel-Cox) | 0.006 | 1 | 0.936 |
| Breslow (Generalized Wilcoxon) | 0.318 | 1 | 0.573 |
| Tarone-Ware | 0.137 | 1 | 0.711 |
Given X covariates, is an assumption for the hazard at time t. h (t, x) = ho (t) x Z (x), where: ho is non-parametric and Z (x) is parametric. For that Cox is considered as semi-parametric and Z= exp (β1X1 + β2X2 +…)
4.1 Hazard Model for Sukuk
It is a known fact that financial data changes over time due to time variation19. This situation is known as time-dependent covariates. However, Cox made an assumption that there is a constant relationship between the dependent variable (hazard rate) and explanatory variables20. This situation is known as proportional hazard (PH). If constant time is violated then the simple Cox model is invalid and time-dependent Cox must be conducted. For this purpose, before sukuk data is regress using Cox, the PH assumption needs to be tested either by numerically or graphically. The test within the following case of sukuk depends on whether distress and non-distress sukuk companies are in proportion with time.
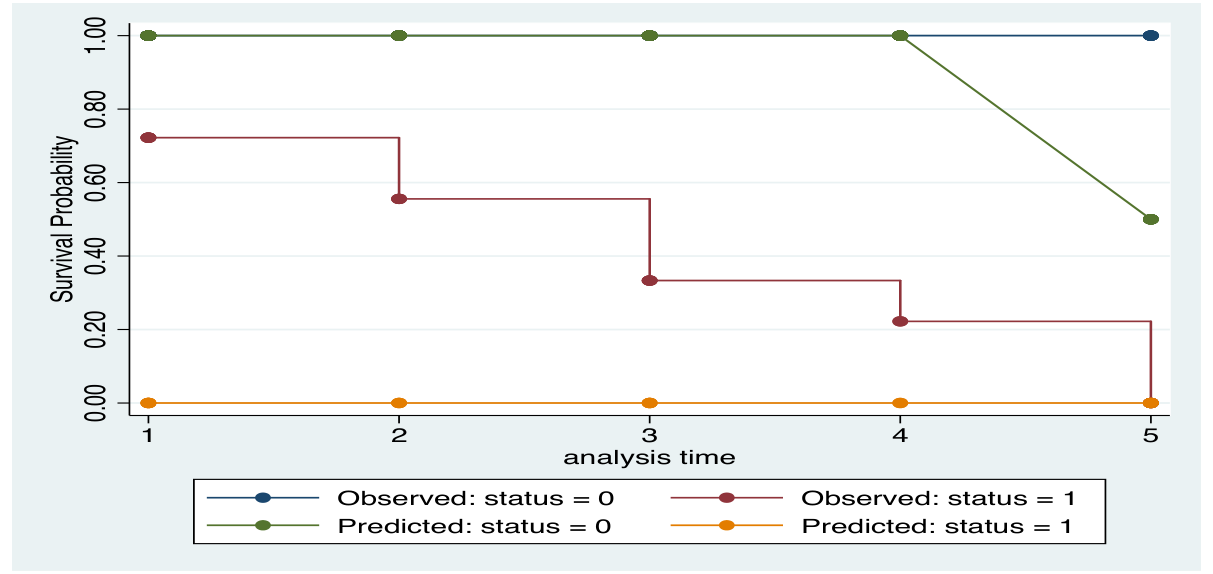
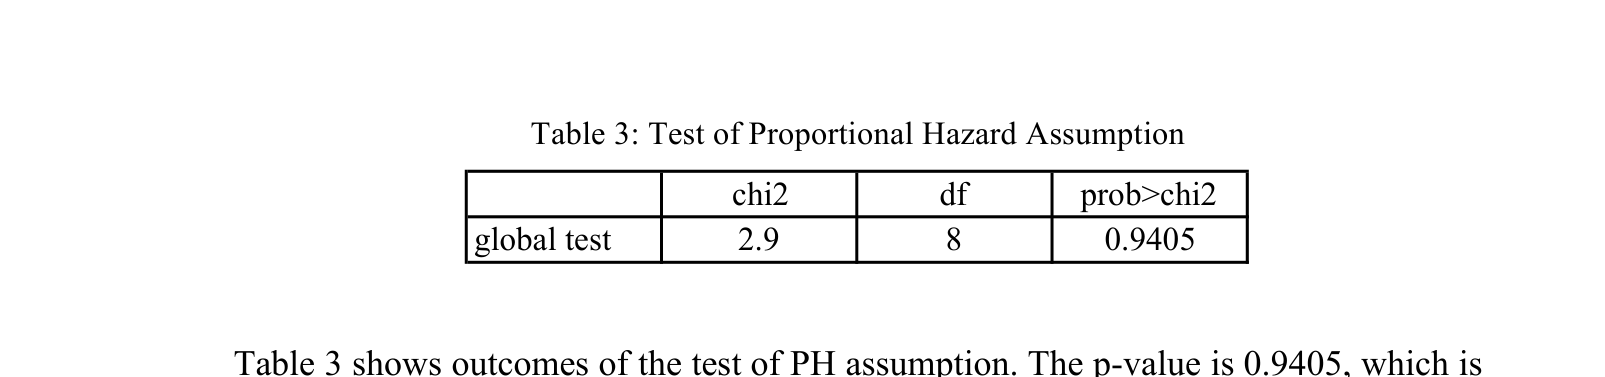
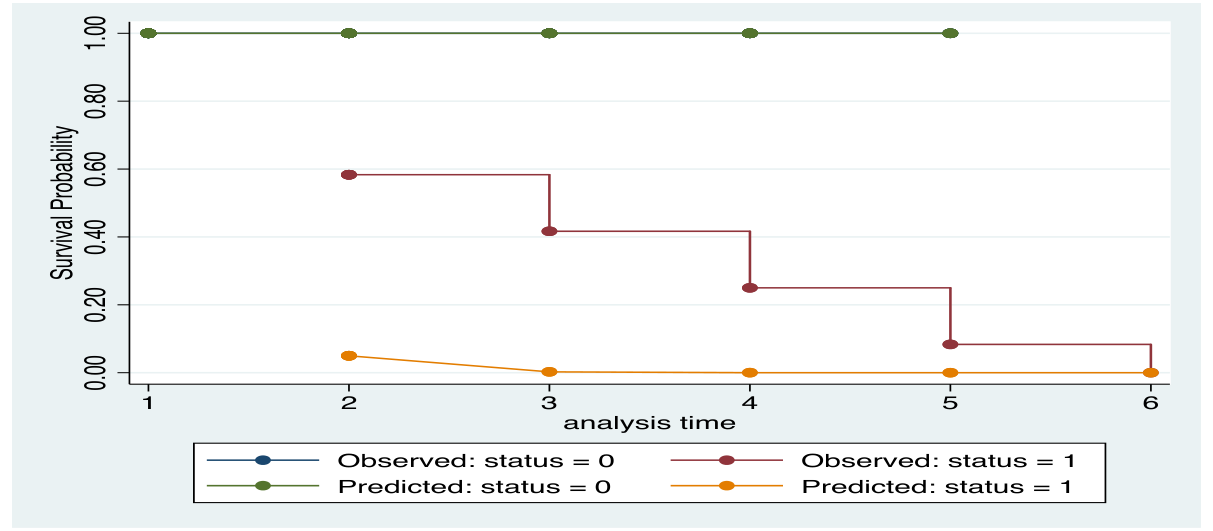
Table 3: Test of Proportional Hazard Assumption chi2 df prob>chi2 global test 2.9 8 0.9405 Table 3 shows outcomes of the test of PH assumption. The p-value is 0.9405, which is not significantly indicating that it does not contradict the proportionate assumption. In other words, it indicates that the distress and non-distress sukuk companies are having hazard rate in proportion with time. These results are validated graphically as demonstrated in Figure 2 and 3. Note: Status 1: distress, status 0: non-distress
| Variable | Coefficient | P-value |
|---|---|---|
| Size | 1.6133 | 0.125 |
| STDEV | -2.1447 | 0.314 |
| WCTA | -0.961 | 0.610 |
| TLTA | 1.1071 | 0.697 |
| OCFCL | -3.6029 | 0.068* |
| OCFTA | 9.0161 | 0.281 |
| OCFsales | -3.15E-07 | 0.895 |
| EBITOCF | -3.85E-06 | 0.687 |
2.06 0.1511 0.15 0.6965 0.00 0.9768 0.03 0.8707 0.40 0.5275 0.38 0.5359 0.00 0.9790 0.11 0.7453
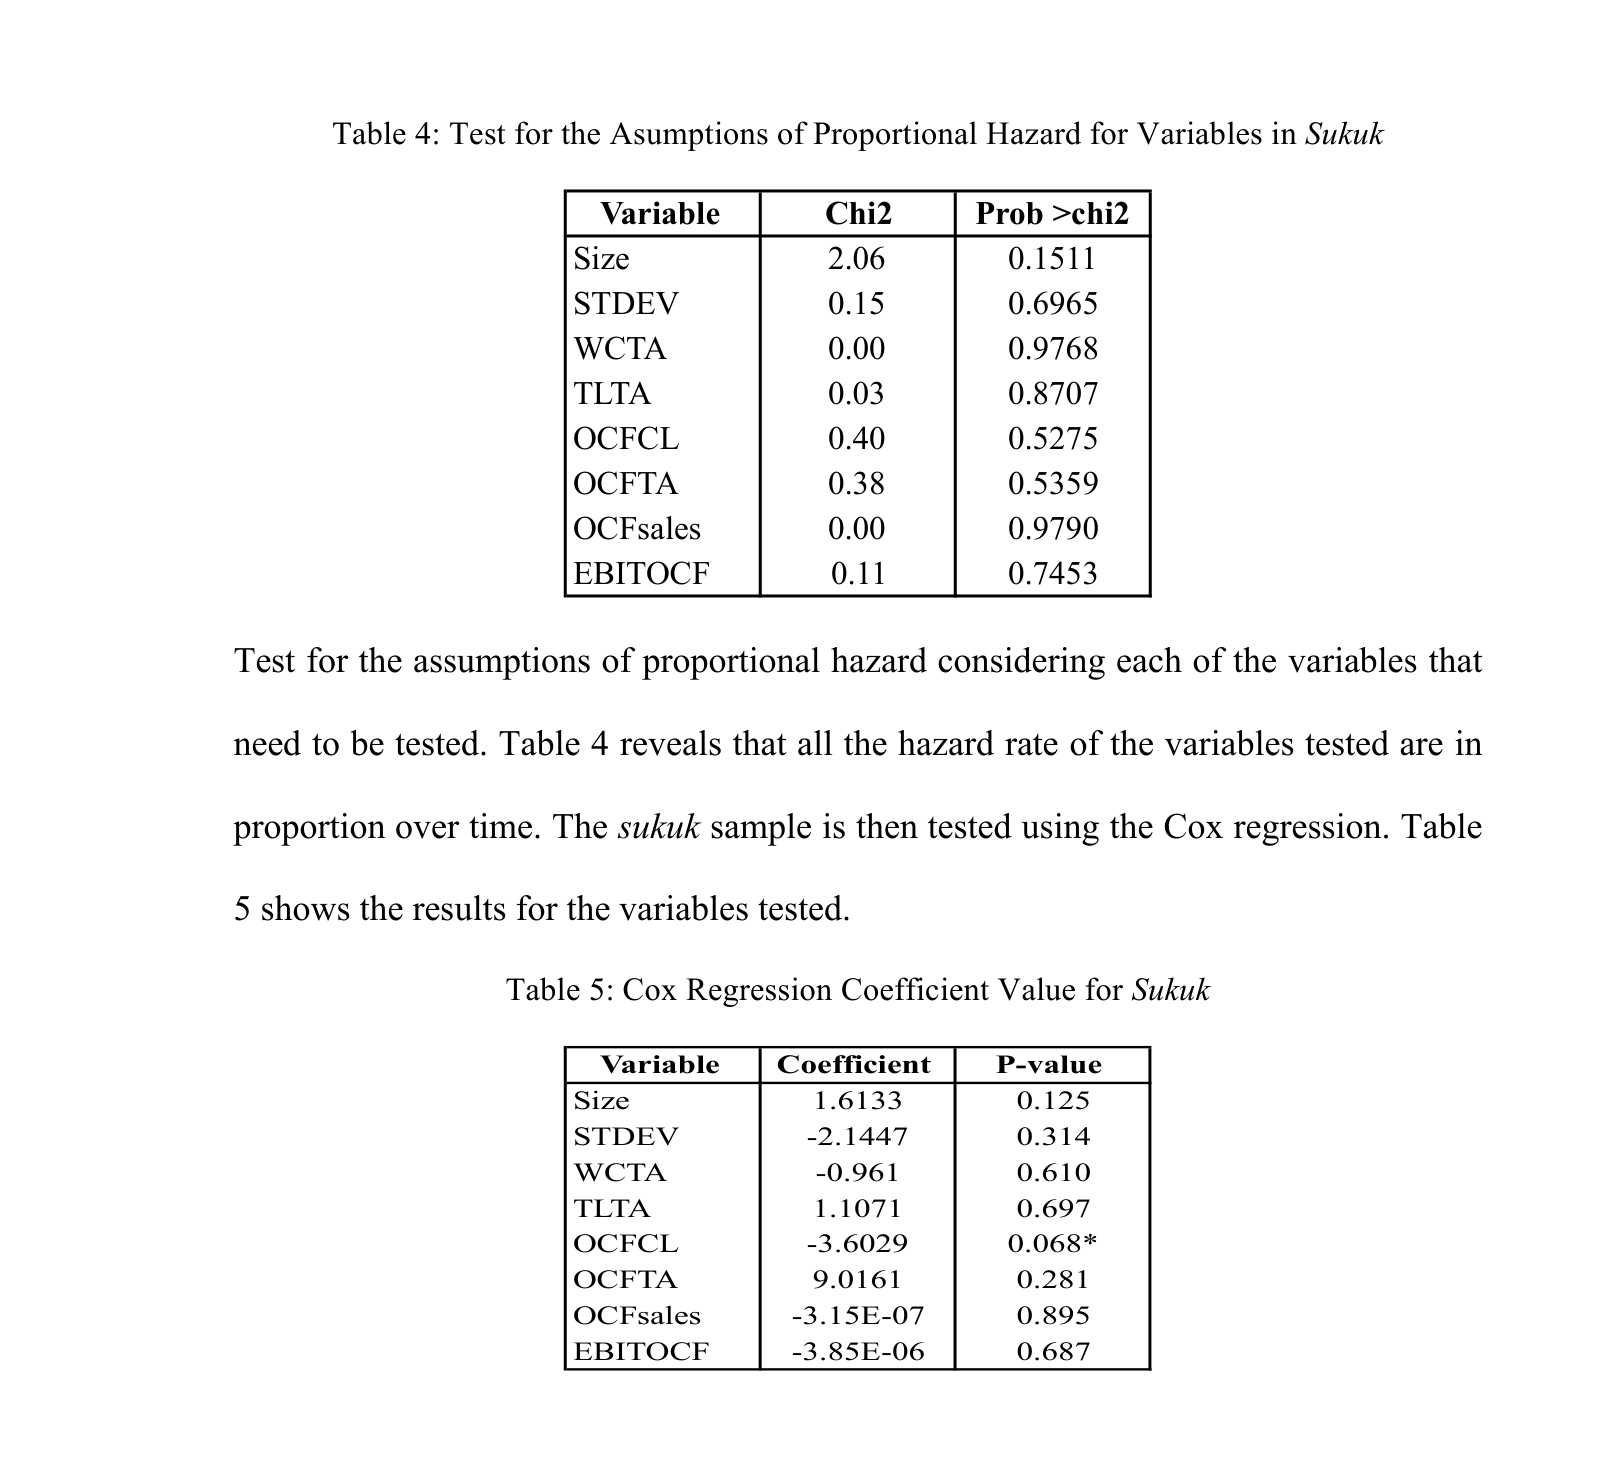
1.6133 0.125 -2.1447 0.314 -0.961 0.610 1.1071 0.697 -3.6029 0.068* 9.0161 0.281 -3.15E-07 0.895 -3.85E-06 0.687 The output only shows OCFCL as a significant variable with p-value 0.068 at significant level 0.10. The result may signify that liquidity ratio measured by operating cash flows to current liabilities is important in determining the hazard of the financial distress for sukuk companies. The coefficient value of -3.6029 demonstrates a negative relationship of financial distress with OCFCL. The lower the OCFCL means the higher the financial distress. This indicates that sukuk companies needs to have a higher OCFCL in order to minimize the potential of financial distress. Day-to-day cash flows and short-term liabilities should be managed efficiently.
Although sukuk is a medium to long-term instruments, yet sukuk cash flows are closely related to the management of current liabilities because sukuk holders entitled periodic returns. For that the firms must manage operating cash flows wisely. Sukuk companies need large amount of current assets to pay its current liabilities. This will ensure company to maintain its liquidity position.
4.2 Hazard Model for Bonds
The same predictors (variables) in sukuk companies are tested for bonds’ companies. Test for bonds are conducted simply to identify whether the same variables could predict hazard for bonds companies. Test of proportional hazard assumption as shows in Table 6 demonstrates that p-value is not significant. This signifies that bonds sample also have hazard rate in proportion over time.

global test 11.06 0.1984 Note: 1= distress, 0= non-distress
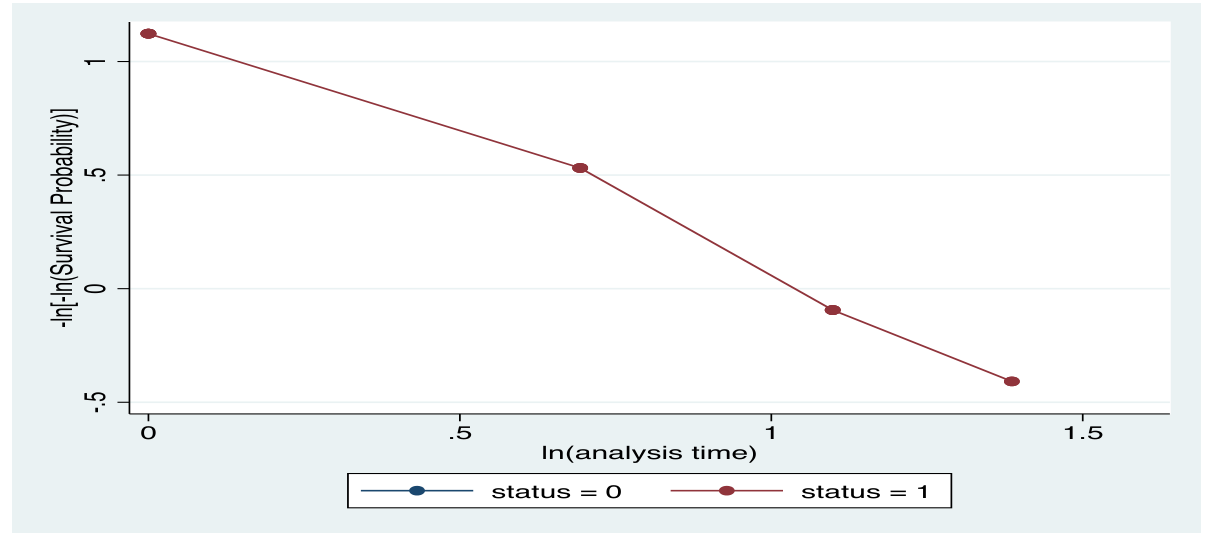
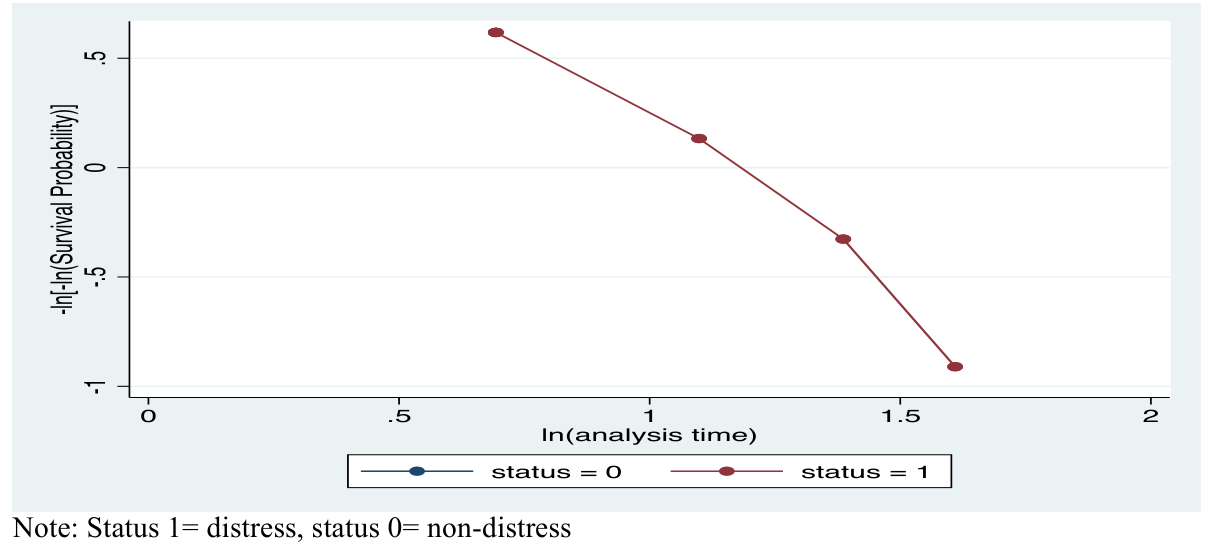
Using graphic evidence, Figure 4 shows that hazard rate for distress bonds (status 1) is declining over time, while for non-distress bonds (status 0) the hazard rate is constant.
EBITOCF 0.01 0.9145 Note: * indicate violating hazard assumption
| Variable | Coefficient | P-value |
|---|---|---|
| Size | -0.2960 | 0.760 |
| STDEV | -3.7066 | 0.235 |
| WCTA | -1.1143 | 0.725 |
| TLTA | -2.9066 | 0.490 |
| OCFCL | -2.8129 | 0.700 |
| OCFTA | -26.7287 | 0.260 |
| OCFsales | 7.9040 | 0.108 |
| EBITOCF | 0.0007 | 0.920 |
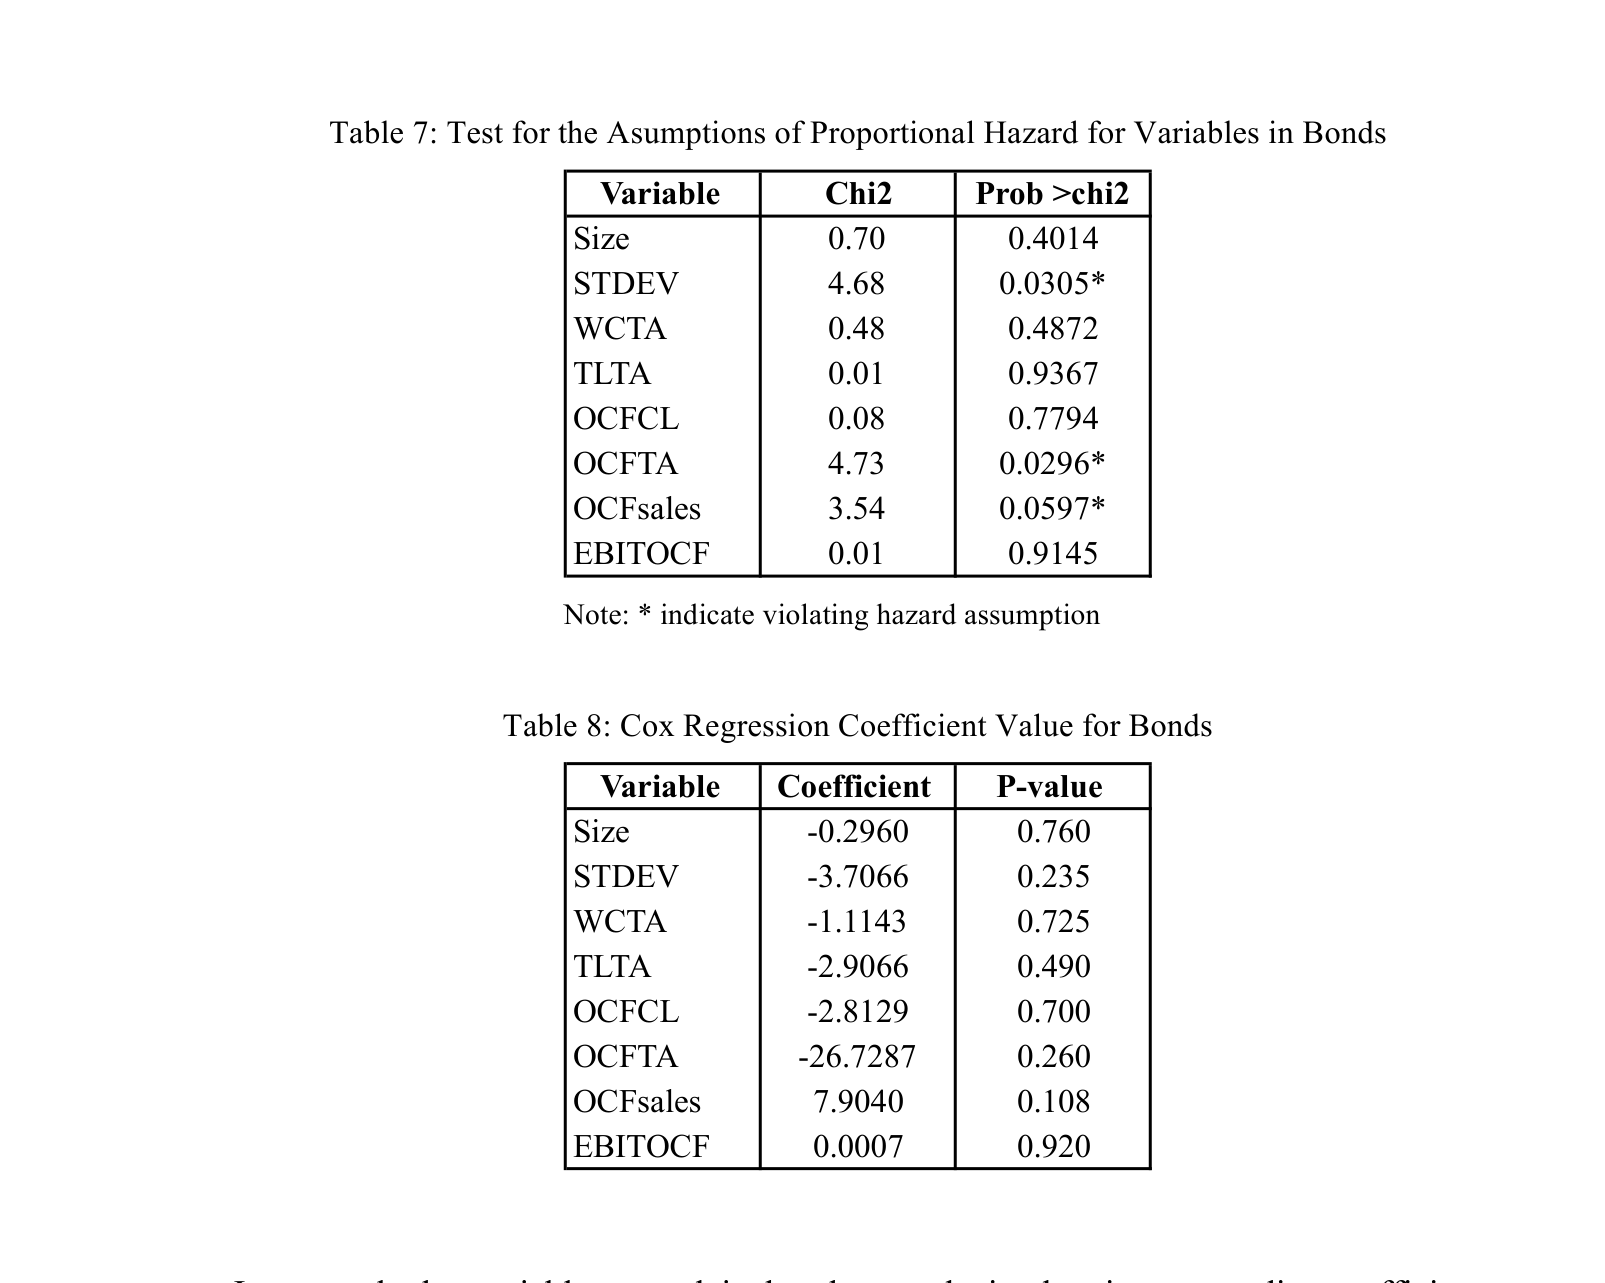
In general, the variables tested in bonds sample is showing contradict coefficient signs. Only STDEV, WCTA and OCFTA recorded the same coefficient signs as in sukuk sample. None of the variables recorded significant value. This reflects that the variables used in predicting financial distress of sukuk companies are not suitable for bonds companies. This is also explaining by the test of proportional hazard assumption for each of the variables. Variables STDEV, OCFTA and OCF sales have p-value less than 0.05 indicating that the hazard rate for variables are not in proportion over time. These results may contribute to the insignificant predictors for bonds.
5. CONCLUSION AND IMPLICATION OF THE STUDY
This research analyzed the practicality of trade-off theory to sukuk and bonds companies. The conventional capital structure theory claims that amount of debts increases the likelihood of bankruptcy. However, the study argues that this agreement was made based on the understanding that bonds are simply a debt. Unlike sukuk, which is unique because it have both debt and equity characteristics. Consequently, this study argues that sukuk might have a different impact on the survival time and probability of financial distress. The results of this study will assist the future researches to identify the survival time of sukuk and bonds companies before the actual financial distress occur. The main finding of this study is identification of factors that influence the survival time of sukuk and bonds companies.
This study provide theoretical as well as practical advantages to address concern of financial distress within the bonds and sukuk companies. Subsequently, the results of the study suggest the theoretical implication based on the understanding of bankruptcy and trade-off theory, while particularly focusing on the perspective of sukuk. In summary, KMS test produced slightly different estimated survival time, 4.769 for sukuk and 5.180 for bonds. This reflects that there is no significant different between the survival time of sukuk and bonds, which means sukuk issuance has no relevant impact on the survival time of the companies. Regardless of whether the companies issued sukuk or bonds, the companies will eventually fall in financial distress problem in similar time. It further indicates that both of these companies have a similar lifetime for the estimated time of survival, until an actual distress takes place. Further, Cox regression was conducted, in order to identify the predictors that contributed to this survival time. It is surprise to see that liquidity ratio measured by operating cash flow to current liabilities (OCFCL) is significant in the case of sukuk, but it is contrary to expectation, as none of these predictors are significant for bonds. This implies that bonds companies might need different predictors to identify factors that contribute to their survival time. The study recommends future researches to analyze the potential predictors of bond companies, as well as their impact on the survival time of these companies. The current study offers a new insight on the predictors; such that the liquidity measured through cash flow variables are more important to sukuk companies in determining the survival time. Consequently, this has signified the roles of liquidity in predicting financial distress for the sukuk companies.
This study also suffers several limitations which include the lack of data to compare between asset-based sukuk and asset-backed sukuk. Should the data is sufficient in the future; the study would recommend the potential researcher to look into this matter. In addition, it is also interesting to see whether the new model could be tested in other countries that are issuing sukuk. The test is vital because it is important to identify whether the model is a country specific or is influenced by the characteristics of sukuk itself. We also recommend the future researcher to employ other statistical model such as artificial neural networks (ANN) which usually practices in the field of information technology.
REFERENCES
Abdullah, N. A. H., Halim, A., Ahmad, H., & Raus, R. M. (2008). Predicting Corporate Failure of Malaysia’s Listed Companies: Comparing Multiple Discriminant Analysis, Logistic Regression and the Hazard Model. International Research Journal of Finance and Economics, (15).
Agarwal, V., & Taffler, R. (2008). Comparing the performance of market-based and accounting-based bankruptcy prediction models. Journal of Banking & Finance, 32(8), 1541–1551. doi:10.1016/j.jbankfin.2007.07.014 Altman, E. I., Iwanicz-Drozdowska, M., Laitinen, E. K., & Suvas, A. (2014).
Distressed Firm and Bankruptcy Prediction in an International Context: A Review and Empirical Analysis of Altman’s Z-Score Model. Available at SSRN 2536340.
Altman. (1968). Predicting Corporate Bankruptcy: The Z-Score Model.
Ariff, M., & Safari, M. (2012). Are Sukuk Securities the Same as Conventional Bonds? Afro Eurasian Studies, 1(1), 101–125.
Aziz, A., Emanuel, D.C. and Lawson, G.H. (1988). Bankruptcy prediction – an investigation of cash flow based models. The Journal of Management Studies,

Back, B., Laitinen, T., Sere, K., and Wezel, M. (1996). Choosing Bankruptcy Predictors Using Discriminant Analysis, Logit Analysis, and Genetics Algorithms. Turku Centre for Computer Science, Technical Report No. 40: 1-18.
Bandyopadhyay, A. (2006). Predicting probability of default of Indian corporate bonds: logistic and Z-score model approaches. The Journal of Risk Finance, 7(3), 255–272. doi:10.1108/15265940610664942 Banos-Caballero, S., García-Teruel, P. J., & Martínez-Solano, P. (2014). Working capital management, corporate performance, and financial constraints. Journal of Business Research, 67(3), 332-338.
Beaver, W. H. (1966). Financial Ratios as Predictors of Failure. Empirical Research in Accounting: Selected Studies. Journal of Accounting Research, 71–111.
Beaver, W. H., McNichols, M. F., & Rhie, J.-W. (2005). Have Financial Statements Become Less Informative? Evidence from the Ability of Financial Ratios to Predict Bankruptcy. Review of Accounting Studies, 10(1), 93–122.
Bhandari, S. B., & Iyer, R. (2013). Predicting business failure using cash flow statement based measures. Managerial Finance, 39(7), 667–676.
doi:10.1108/03074351311323455
Blum, M. (1974). Failing Company Discriminant Analysis. Journal of Accounting Research, 12(1). Retrieved from http://www.jstor.org/discover/10.2307/2490525?uid=3738672&uid=2129&uid=2 &uid=70&uid=4&sid=21103794469843 Caballo Trebol, Á. (2013). Measurement of credit risk : development of a new (Vol .
5) tool. Comillas Pontifical University.
Cakir, S., & Raei, F. (2007). Sukuk vs. Eurobonds: Is There a Difference in Value-at-Risk? (No. 7). IMF Working Paper (Vol. 7).
Carslaw, C.A. and Mills, J.R. (1991). Developing ratios for effective cash flow statement analysis. Journal of Accountancy, pp. 63-70.
Chancharat, N. (2008). An empirical analysis of financially distressed Australian companies : the application of survival analysis. University of Wollongong.
Charitou, A., Neophytou, E. and Charalambous, C. (2004). Predicting corporate failure: Empirical evidence for the UK. European Accounting Review, 13(3), 465-497.
Chava, S., & Jarrow, R. A. (2004). Bankruptcy Prediction with Industry Effects.
Review of Finance, 8(4), 537–569. doi:10.1093/rof/8.4.537 Chen, M. Y. (2011). Predicting corporate financial distress based on integration of decision tree classification and logistic regression. Expert Systems with Applications, 38(9), 11261-11272.
Dambolena, I., and S.Khoury. (1980). Ratio Stability and Corporate Failure. The Journal of Finance, 35 (4), 1017-1026.
Darayseh,M, Waples E, Tsoukalas D., (2003). Corporate failure for manufacturing industries using firms specifics and economic environment with logit analysis.

Deakin. (1972). A Discriminant Analysis of Predictors of Business Failure. Journal of Accounting Research, 10(1). Retrieved from http://www.jstor.org/discover/10.2307/2490225?uid=3738672&uid=2129&uid=2 &uid=70&uid=4&sid=21103695365497 Dimitras, R. Slowinksi, R. Susmaga and C. Zopounidis. (1999). Business failure prediction using rough sets. European Journal of Operational Research, 114(2): 263-280.
Dumont, G., & Schmit, M. (2014). Tier-1 MFIs’ Financial Performance: Cash-Flow Statement Analysis Version 2.0.
Dusuki, A. W., & Mokhtar, S. (2010). Critical Appraisal of Shari’ah Issues on Ownership in Asset-Based Sukuk as Implemented in the Islamic Debt Market. ISRA Research Paper, 8.
Elkamhi, R., Ericsson, J., & Parsons, C. A. (2012). The cost and timing of financial distress. Journal of Financial Economics, 105(1), 62-81.
Figlewicz, R. and Zeller, T. (1991). An analysis of performance, liquidity, coverage and capital ratios from the statement of cash flows. Akron Business &Economic Review, Vol. 22 No. 1, pp. 64-81.
Garcia, F., Guijarro, F., & Moya, I. (2013). Monitoring credit risk in the social economy sector by means of a binary goal programming model. Service Business, 7(3), 483-495.
Gentry, J.A., Newbold, P. and Whitford, D.T. (1985). Classifying bankrupt firms with funds flow components. Journal of Accounting Research, pp. 146-160.
Ginoglou, D., Agorastos K. and Hatzigagios T. (2002). Predicting Corporate Failure of Problematic Firms in Greece with LPM Logit Probit and Discriminant Analysis Models. Journal of Financial Management and Analysis 15(1), 1-15 Godlewski, C. J., Turk-ariss, R., & Weill, L. (2011). Do markets perceive sukuk and conventional bonds as different financing instruments?.
Grice, J. S., & Dugan, M. T. (2003). Re-estimations of the Zmijewski and Ohlson bankruptcy prediction models. Advances in Accounting, 20, 77-93.
Grice, J. S., & Ingram, R. W. (2001). Tests of the generalizability of Altman’s bankruptcy prediction model. Journal of Business Research, 54(1), 53–61. doi:10.1016/S0148-2963(00)00126-0 Hill, N. T., Perry, S. E., & Andes, S. (2011). Evaluating firms in financial distress: An event history analysis. Journal of Applied Business Research (JABR), 12(3), 60-71.
Hillegeist, S., Keating, E. K., & Lundstedt, K. G. (2004). Assessing the Probability of Bankruptcy. Review of Accounting Studies, 9, 5–34.
Huang, D. T., Chang, B., & Liu, Z. C. (2012). Bank failure prediction models: for the developing and developed countries. Quality & Quantity, 46(2), 553-558. Industries using firms specifics and economic environment with logit analysis.
Jensen, M., & Meckling, W. (1976). Theory of firm: Managerial behavior, agency costs, and capital structure. Journal of Financial Economics, 3, 305–360.
Kordlar, A. E., & Nikbakht, N. (2011). Comparing Bankruptcy Prediction Models in Iran. School of Doctoral Studies (European Union) Journal, 24–31.
Korol, T. (2013). Early warning models against bankruptcy risk for Central European and Latin American enterprises. Economic Modelling, 31, 22-30.
Lahsasna, A., & Lin, L. S. (2012). Issues in Islamic Capital Markets: Islamic bonds/Sukuk. In 3rd International Conference on Business and Economic Research (3rd ICBER 2012) Proceeding (pp. 495–512). Bandung, Indonesia.
Lakshan, A. I., & Wijekoon, W. M. H. N. (2014). The use of financial ratios in predicting corporate failure in Sri Lanka. Journal on Business Review (GBR), 2(4).
Lam, M., & Trinkle, B. S. (2014). Using Prediction Intervals to Improve Information Quality of Bankruptcy Prediction Models. In Advances in Business and Management Forecasting (pp. 37-52). Emerald Group Publishing Limited.
Lane, W.R., S.W. Looney and J.W.Wansley (1986). An Application of the Cox Proportional Hazards Model to Bank Failure. Journal of Banking and Finance, 10, pp.511-532.
LeClere, M.J. (2005). Time-dependent and time-invariant covariates within a proportional hazards model: a financial distress application. Review of Accounting and Finance. Vol. 4 No. 4, pp. 91-109.
Lim, T. C. (2012). Determinants of capital structure empirical evidence from financial services listed firms in China. International Journal of Economics and Finance, 4(3), p191.
Low, S.-W., Nor, F. M., & A, Z. A. (2001). Predicting Corporate Financial Distress using the Logit Model: The Case of Malaysia. Asian Academy of Management Journal, 6(1), 49–61.
Luoma M, Laitinen E. (1991). Survival analysis as a tool for company failure prediction. International Journal of Management Science (OMEGA) 19: 673– 678.
Majid, H. A., Shahimi, S., & Abdullah, M. H. S. B. (2011). Sukuk Defaults and Its Implication : A Case Study of Malaysian Capital Market. In 8th International Conference on Islamic Economic and Finance (pp. 1–37). Center for Islamic Economics and Finance, Qatar Faculty of Islamic Studies, Qatar Foundation.

Mannasoo, K., & Maripuu, P. (2015). Company Performance, Investment Decision, and Cyclical Sensitivity: A Dynamic Estimation on Company Microdata. Eastern European Economics, 53(1), 25-38.
McKee, T.E. and Greenstein, M. (2000). Predicting bankruptcy using recursive partitioning and a realistically proportioned data set. Journal of Forecasting, Vol.

Mills, J.R. and Yamamura, J.H. (1998). The power of cash flow ratios. Journal of Accountancy, pp. 53-61.
Modigliani, F., & Miller, M. H. (1958). The Cost of Capital, Corporation Finance and the Theory of Investment. The American Economic Review, XLVIII(June).
Mohan, A., & Mohan, V. (2015). Human Inadequacies in Corporate Failures An Empirical Study. Journal of Advanced Research in Public Policy & Administration, 1(2), 6-11.
Nagano, M. (2013). Who Issues Sukuk and Why ? An Analysis of Islamic Bond Issuing Determinants (pp. 1–32).
Naranjo, P., Saavedra, D., & Verdi, R. S. (2013). Financial reporting regulation, information asymmetry and financing decisions around the world. Available at SSRN 2147838.
Nimalathasan, B., & Priya, K. (2013). Cash flow ratios for evaluating financial performance: A case study of listed manufacturing company in Sri Lanka. International Journal of Physical and Social Sciences, 3(11), 244. No. 2, pp.25-34.
Ohlson, J. A. (1980). Financial Ratios and the Probabilistic Prediction of Bankruptcy. Journal of Accounting Research, 18(March 1979).
Polemis, D., & Gounopoulos, D. (2012). Prediction of distress and identification of potential M&As targets in UK. Managerial Finance, 38(11), 1085–1104. doi:10.1108/03074351211266801 Rizzi, J.V. (1994). Determining Debt Capacity. Commercial Lending Review, Vol. 9.
Securities Commission. (2012). Annual Report 2012.
Shahida, S., & Sapiyi, S. (2013). Why Do Firms Issue Sukuk Over Bonds ? Malaysian Evidence. In Prosiding PERKEM VII, Vol.2 (Vol. 2, pp. 551–573).
Shumway, T. (2001). Forecasting Bankruptcy More Accurately : A Simple Hazard Model. The Journal of Business, 74(1), 101–124.
Sobehart, J. R., and R.M. Stein. (2000). Moody’s Public firm Risk Model: A Hybrid Approach to Modeling Short Term Default Risk. New York:Moody’s Investors Services.
Spaliara, M., & Tsoukas, S. (2013). What matters for corporate failures in Asia ?
Exploring the role of firm-specific characteristics during the Asian crisis.
Structural Change and Economic Dynamics, 26(August), 83–96.
Sulaiman, M., Jili, A., & Sanda, A. U. (2001). Predicting corporate failure in Malaysia: An application of the logit model to financial ratio analysis. Asian Academy of Management Journal, 6(1), 99–118.
Sun, L. (2007). A re-evaluation of auditors’ opinions versus statistical models in bankruptcy prediction. Review of Quantitative Finance & Accounting, Vol. 28
Ugurlu, M. and Aksoy, H. (2006). Prediction of corporate financial distress in an emerging market: the case of Turkey. Cross Cultural Management, Vol. 13 No.
4, pp. 277-95.
Warner, J. B. (1977). Bankruptcy Costs: Some Evidence. The Journal of Finance, 32(2), 337–347.
Wilson, R. (2008). Innovation in the structuring of Islamic sukuk securities.
Humanomics, 24(3), 170–181. doi:10.1108/08288660810899340 Zmijewski, M. E. (1985). Methodological Issues Related to the Estimation of Financial Distress Prediction Models. Journal of Accounting Research, 22, 59– 83.
Notes
1 In the case of asset-based sukuk, company can use their internal cash to pay the periodic distribution. Hence, investors have recourse on the asset-based sukuk company. Rating of asset-based sukuk is benchmarked to the financial performance of the company (Elmalki and Dennis, 2010; Hasan, 2013). 2 Raising equity is costly, time consuming and company may lose certain power to make decision. 3 These numbers of distressed sukuk and bonds companies are only considered based on completed financial data. The total distressed companies are actually more than these. 5 Multiple Discriminant Analysis (MDA) was first used in the field of biological and behavioral sciences before it became popular in the field of finance. MDA was initially applied to improve the work of Beaver (1966) who used univariate technique to predict financial distress. Beaver reveals that cash flow to debt ratio as the best single predictor for financial distress. 6 Altman did not reveal the list of the 22 ratios. The ratios were not selected on theoretical basis, however were selected based on the popularity in the earlier researches and its relevancy to the study. 7 Tested the Altman model using the 1980s manufacturing companies’ sample. The findings show that the error rate is increasing to 18.5 percent for Type I error and 25.1 percent for Type II error, as compared to the Altman’s original model 8 Least importance based on scaled vector rankings and it also recorded negative coefficient sign 9 Tested generalizability of the Altman model by using both of bankruptcy and financial distress companies9 from the year of 1985 to 1987. 10 Multivariate significance test also identified that RETA and EBIT/TA were significant at the 0.05
11 This study applied Altman’s original model using sample from the years of 1962-1999 non-financial companies. The result shows that using different sample, Altman’s original model is capable to predict correct classification up to 77.6 percent. 12 Re-worked Altman’s original model using the Indian bonds companies between the years of 1998
2004. The predictive accuracy is 80 percent and 88 percent for a year and two year before the 13 Hillegeist et al. (2004) argues that assets volatility is a crucial variable in predicting bankruptcy because it captures the probability that the value of the company’s assets will decline to such an extent that the company will be unable to repay its debts. Two companies with identical leverage ratios can have substantially different probability of bankruptcy depending on their asset volatilities. Hence, volatility is an important omitted variable in both the Altman (1968) and Ohlson (1980) bankruptcy
14 The new coefficient sign is positive for SIZE, WCTA, NITA, FUTL, and OENEG. This is in contrast to negative sign as identified in original Ohlson model. 15 Zmijewski (1984) variables are returns on assets (ROA), total debt to total assets (TLTA) and current asset to current liabilities (CACL). 16 Grice & Ingram (2001) included companies whose bonds were rated CCC or below. However, this study is considering all types of downgraded. Any rating below BBB is considered as non-investment 17 The paired sample technique has been extensively used by a number of studies (for example, Altman 1968; Back et al. 1996; Beaver 1966; Blum 1974; Charitou, Neophytou & Charalambous 2004; Dambolena & Khoury 1980; Darayseh, Waples & Tsoukalas 2003; Deakin 1972; Dimitras et al. 1999; Gentry, Newbold & Whitford 1985; Ginoglou, Agorastos & Hatzigagios 2002; He & Kamath 2006; McKee and Greenstein, 2000; and Ugurlu & Aksoy 2006). 18 Survival analysis is a semi-parametric because it does not assumed shape for the hazard functions. This is unlike parametric model, which set the parameter for the functions. Table 2: Overall Comparison Note: Issuance 1: sukuk, issuance 2: bonds 19 Often skewed and not likely to be normal distribution. 20 The form of a time-varying covariate is much more complicated than in Cox models with fix (non–time-varying) covariates which involves constructing a function of time (Fisher & Lin, 1999). Note: Status 1: distress, status 0: non-distress Table 6: Test of Proportional Hazard Assumption