
Chapter 5
Strategic Allocation of International Reserves:
Case for Malaysia
Kamola Bayram, Adam Abdullah and Ahamed Kameel Mydin Meera
Abstract
This research sought to identify the optimal level of gold as a reserve asset to be held in portfolios of central banks in order to enhance stability of nations in times of economic, financial and/or geopolitical turmoil by preserving the value of assets held in central bank reserves. After the collapse of the Bretton Woods fixed exchange rate system in 1971, countries moved towards floating exchange rates and the expectation was that requirement for foreign reserves would decrease. However, central banks currently hold more foreign exchange reserves, with the aim of enhancing the credibility of their exchange rate policy. Gold, which was the main reserve asset prior to the collapse of the Bretton Woods system, has increased as a reserve asset once again following the global financial crisis of 2008 (GFC), given gold’s characteristics as a safe haven asset and a store of value. This study analysed official reserves of Malaysia. The Black-Litterman model was implemented to build a new strategic portfolio with optimal allocation to gold.
1.0 Introduction
One of the major developments in the global financial system over the past two decades was the rapid growth of foreign exchange reserves around the world (Mohanty and Turner, 2006; ECB, 2006). The phenomenon arises as a response to the financial crisis of the 1990’s when emerging markets started to accumulate enormous amounts of foreign reserves as a self-insurance against the volatility associated with the financial globalization (Aizenman and Marion, 2003; Aizenman and Lee, 2008). Today, due to its role as an international reserve currency, biggest share of foreign reserves held by central banks consists of U.S. dollars (Eichengreen, 1993; Eichengreen, 2004; Eichengreen, 2011). Central banks are responsible to their citizens and government for the prudent management of what is part of the wealth of the nation. During 1990s the central banks were obliged to obtain a financial return or yield from national reserves whereas after the global financial crisis of 2007-2008 (GFC) stability and prudence considered to be more vital. Therefore, the official reserves aimed to cover not only day to day needs for foreign exchange but also preserve their value during times of economic turbulence (WGC, 2010a).
The GFC explicitly showed that the U.S. economy and its financial system are fragile in nature and not protected against economic shocks. Therefore, following the GFC central banks started to consider the diversification of official reserves and change the composition of official reserves (Aizenman et al., 2015). Despite the fact that the major share of official reserves is still composed of the U.S. dollar denominated assets, the share of other currencies and commodities such as Chinese Renminbi (RMB) and gold is growing significantly over time (WGC, 2015b). Much research also points to the benefits of inclusion of gold holdings as leading to a more balanced portfolio (Johnson and Soenen, 1997; Sherman, 1982; Ciner, 2001; Egan and Peters, 2001; Davidson et al., 2003; Draper et al., 2006). Gold reserves are especially important during times of financial or geopolitical turbulences (Harmston, 1998). Traditionally gold has played an important role during times of political and economic turmoil and during equity market crises; when gold has responded with higher prices (Melvin and Sultan, 1990).
The importance of gold in portfolio diversification was studied for many years. For example, Sherman (1982) suggested that a portfolio with 5% and 10% proportions in gold can lower volatility and increase returns. Jaffe (1989) found that gold has a low correlation with most assets over the period 1971-1987, suggesting that gold may reduce portfolio risk. Davidson et al. (2003) pointed out that diversification status of gold was renewed after the 1997/1998 Asian currency crisis. Hence, investors turned to gold as a hedging asset. In times of financial shock assets such as stocks and bonds are positively correlated hence their price tends to co-move whereas, the price of gold is negatively correlated with other financial assets. Therefore, gold can play an important role as a diversifier, acting as a stabilizing control for investment portfolios. Thus, a portfolio of equities with gold would result in a portfolio of assets moving independently, with low correlation with risky assets (Lucey et. al, 2006).
Draper et al. (2006) suggested that portfolios including gold, silver or platinum perform significantly better than those without it. Hence, investors not only minimize risk by adding gold into their portfolio but also increase the returns as well. Despite, the importance of gold as a safe haven asset, majority of countries do not have enough gold reserves in the central banks (Bayram, 2017). This study seeks to identify what the optimal level of gold reserves should to be held by the Central bank of Malaysia (Bank Negara Malaysia or (BNM) to preserve the value of official reserves in times of financial turmoil.
2.0 Methodology
In 1991, Fisher Black and Robert Litterman of Goldman Sachs presented the Black-Litterman model (Black & Litterman, 1991). The model is an upgraded version of Markowitz’s Mean-Variance approach. The Black-Litterman model helps central banks to overcome key shortcomings of Mean-Variance approach such as lack of intuition, the input sensitivity of a portfolio, and high concentration. A new expected return vector is derived by using the Bayesian paradigm which pools views of an investor related to the expected returns of a single asset or multiple assets, known as absolute view and relative view respectively, with the market equilibrium vector. Thus, used along with an allocation process, the Black-Litterman model originates portfolios which are more diversified and more balanced.
The Black-Litterman model, however, is a sophisticated method which is not easy to replicate. The implementation of the Mean-Variance approach, for example, is explained in details in Markowitz (1952) thus making an application reproducible. Black and Litterman (1991) do not deliver key particulars and data crucial to reproduce the process. The parameter presented in the paper is a fraction which characterises weights of investor’s views.
In their second study, Black and Litterman (1992) provide a more comprehensive discussion by introducing input data and numbers of results. However, vital equations necessary to apply the model are given by the posterior equation was not given and introduced until Black and Litterman (1999) later work, which is:
The first study that described the step-by-step application of the Black-Litterman model is Idzorek (2007). Idzorek made a significant contribution to the literature of the Black-Litterman model by providing a step-by-step guide into the reproduction of the model, with numerical examples and thorough explanations. In this study we follow Idzorek (2007).
3.0 Strategic Portfolio Allocation
The objective this study is to propose an optimal asset allocation based on the Black Litterman model to be held in official reserves of Central Bank of Malaysia (BNM). The researcher aimed to derive a new portfolio which shall provide resilience to any potential financial, economic or geopolitical turmoil. Central banks hold in their official reserves monetary assets such as long term and short term sovereign bonds of countries whose currencies are included into Special Driving Rights (SDR) basket and gold. In time of writing SDR consists of four reserve currencies namely, US dollar, Euro, British pound and Japanese yen. Fifth reserve currency approved by the IMF is Chinese Renminbi which took effect on 1st October 2016. Central banks keep confidential detailed information on the exact composition of their FX holdings. The only information available on their official websites is data on aggregate holdings of the FX securities and amount of gold. Since our analysis requires the information on reserve composition we used Currency Composition of Official Foreign Exchange Reserves (COFER) provided by the IMF as a proxy.
Table 1: World – Allocated Reserves by Currency for 2015 Q4 4,226,014.00 64% 311,535.00 5% 249,173.00 4% 1,343,699.00 20%
| Claims in US dollars | 4,226,014.00 | 64% |
|---|---|---|
| Claims in Pounds sterling | 311,535.00 | 5% |
| Claims in Japanese yen | 249,173.00 | 4% |
| Claims in Euros | 1,343,699.00 | 20% |
| Others | 475,267.00 | 7% |
| Total | 6,605,688.00 | 100% |
Source: IMF.
Table 1 provides information on the composition of world allocated reserves as at 2015 Q4. The largest share 64% is taken by US dollar assets, second largest share (20%) is taken by Euro denominated assets, with Pound sterling and Japanese yen are 5% and 4% respectively. We start our analysis with deriving the variance – covariance Matrix of excess returns (Ʃ) which is presented in Table 2.
| JPY | USD | GBP | EURO | Gold | |
|---|---|---|---|---|---|
| JPY | 0.89057 | 0.50228 | 0.42579 | 0.08070 | -0.07582 |
| USD | 0.50228 | 0.94533 | 0.70963 | 0.14143 | -0.09278 |
| GBP | 0.42579 | 0.70963 | 0.73823 | 0.09777 | -0.04172 |
| EURO | 0.08071 | 0.14143 | 0.09777 | 0.42096 | -0.00738 |
| Gold | 0.07582 | -0.09278 | -0.04172 | 0.00737 | 0.38536 |
| Variance-covariance matrix displays the extent to which | |||||
| corresponding elements from two sets of ordered data move in the | |||||
| same direction which is known as a linear relationship between the | |||||
| two variables. Positive coefficient corresponds to the co-movement | |||||
| of variables in the same direction, whereas the negative coefficients | |||||
| interpreted as a movement of the variables in different directions. From | |||||
| Table 2 one can see that covariance among securities is positive which | |||||
| indicates that in time of market turmoil the prices will fall together. | |||||
| Remarkably, the covariance of gold with all other government securities | |||||
| is negative. Which means that when securities face downturn the price | |||||
| of gold shall rise thusly proving the role of gold as a safe haven asset. | |||||
| The main point distinguishing the Black Litterman model form the | |||||
| Mean – Variance optimization is that it makes possible the inclusion of | |||||
| specific expectation of a reserve manager on the future performance of | |||||
| the assets, whereas Mean-Variance optimization takes into account only | |||||
| the historical performance of the asset. In this study we have five asset | |||||
| classes namely four long term government bonds denominated in the US | |||||
| dollar, Euro, British pound, Japanese yen and gold. We set two views on | |||||
| the future performance of the assets referring to the performance of the | |||||
| assets during GFC as depicted in Figure 1. |
Variance-covariance matrix displays the extent to which corresponding elements from two sets of ordered data move in the same direction which is known as a linear relationship between the two variables. Positive coefficient corresponds to the co-movement of variables in the same direction, whereas the negative coefficients interpreted as a movement of the variables in different directions. From Table 2 one can see that covariance among securities is positive which indicates that in time of market turmoil the prices will fall together. Remarkably, the covariance of gold with all other government securities is negative. Which means that when securities face downturn the price of gold shall rise thusly proving the role of gold as a safe haven asset.
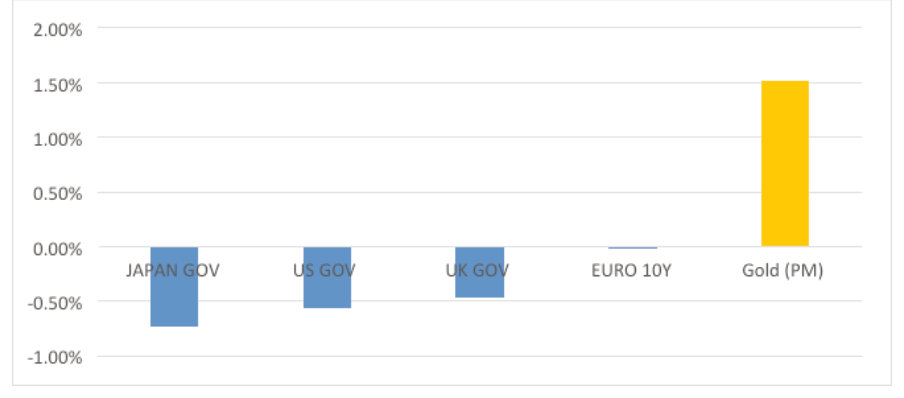
The main point distinguishing the Black Litterman model form the Mean – Variance optimization is that it makes possible the inclusion of specific expectation of a reserve manager on the future performance of the assets, whereas Mean-Variance optimization takes into account only the historical performance of the asset. In this study we have five asset classes namely four long term government bonds denominated in the US dollar, Euro, British pound, Japanese yen and gold. We set two views on the future performance of the assets referring to the performance of the assets during GFC as depicted in Figure 1.
Source: Bloomberg, LBMA
As can be seen from Figure 1 the best performing asset during the GFC was gold with its price increasing up to 2% monthly. Whereas monthly returns on all government bonds was negative with monthly returns of -0.56%, -0.02%, -0.56% and -0.73% for US, Euro, UK and Japan sovereign bonds respectively. Based on the information provided in Figure 1, we set our views as follows:
View 1 – Gold will outperform US denominated securities by 4% (Confidence of View = 50%); by following Idzorek (2007), LC for each view is set as 50%.
View 2 – GBP denominated assets will outperform JPY denominated assets by 100 basis points (Confidence of View = 50%).
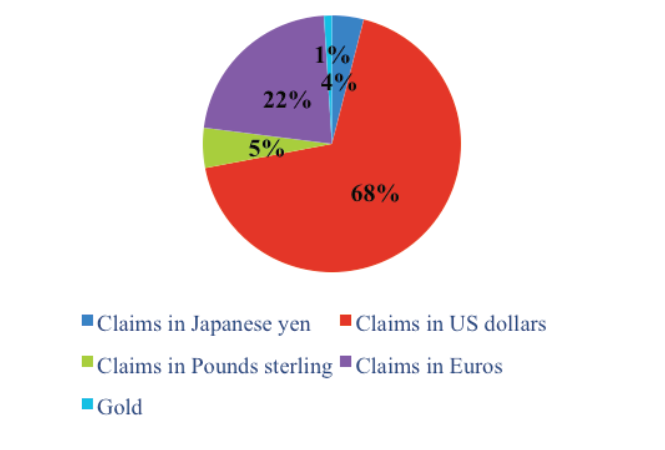
Here, it is important to highlight that Central bank may reapply the model with information available only to them (disclosure of composition of foreign exchange), attached their own specific views on the future performance of the assets to derive results reflecting their very own expectations. We implement the proposed model for BNM. As the end of Q2 2018 the total amount of BNM’s official reserves amounted to 104,656.05 billion USD. The composition of the reserves of BNM is given in Figure 2.
Source: BNM, WGC, IMF
In general, 99% of the total reserves of BNM are composed from FX and only 1% is allocated into gold. Referring to IMF’s COFER data we estimate that USD denominated assets constitute the largest share (68%) of total reserves. 22% is allocated into Euro denominated assets. Claims in GBP and JPY constitute 5% and 4% of the total reserves respectively. Allocation to gold is negligible. Table 3 illustrates a new combined return vector E[R]BNM, implied equilibrium return vector ΠBNM, current weights of assets in BNM portfolio WBNM and new weights derived using the Black – Litterman model WBL_BNM.
| New | Implied | |
|---|---|---|
| Combined | Equilibrium | |
| Asset | Return | Difference Return W W |
| Class | Vector E[R] BNM | E[R] – Π BL_BNM BNM Vector Π BNM |
| JPY | 0.83 | 1.25 -0.41 7% 4% |
| USD | 1.35 | 2.19 -0.84 42% 68% |
| GBP | 1.05 | 1.68 -0.62 2% 5% |
| EURO | 0.47 | 0.59 -0.12 22% 22% |
| GOLD | 0.18 | -0.20 0.37 27% 1% Total 100% 100% |
| According to the results illustrated in Table 3, the difference | ||
| between expected returns derived from the Black – Litterman model and | ||
| implied equilibrium returns for Gold and USD denominated assets are | ||
| equal to 0.37 and -0.84 respectively. The reason is that an investor is | 73 |
WBL_BNM
WBNM
E[R] – Π
E[R]BNM
ΠBNM
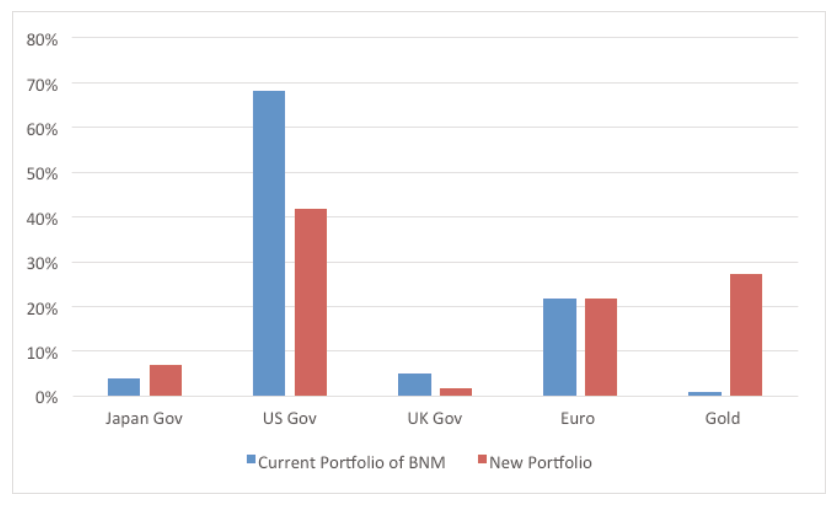
According to the results illustrated in Table 3, the difference between expected returns derived from the Black – Litterman model and implied equilibrium returns for Gold and USD denominated assets are equal to 0.37 and -0.84 respectively. The reason is that an investor is positive on return on gold and negative on return on USD denominated assets. There is no significant fluctuation in Euro denominated assets with expected returns of 0.47 and 0.59 for Black-Litterman expected returns and implied equilibrium returns respectively. Figure 3 illustrates the allocation of assets in current portfolio and new (posterior) portfolio derived using the Black-Litterman model.
Source: IMF, BNM and author’s calculations
In current portfolio more than 68% of reserves is allocated into USD denominated assets. This number however, faced 26% reduction in the new portfolio becoming 42%. There is almost no change in Euro denominated assets. Meanwhile allocation in gold increased 27 times so that the new weight for gold is 27%. This means that BNM is to reduce its USD denominated assets from 68% to 42% and increase its gold holdings from currently 1% to 27%.
4.0 Conclusion
Today we are living in a world prone to the financial crisis. Emerging market central bankers need to diversify official reserves in favour of assets which have a safe haven features, that is negatively correlated with other financial assets during the times of financial crisis. For example, following the GFC China, India and Russia started to sharply increase their official gold holdings. According to some financial experts it is a desire of ‘super emerging markets’ to signal their economic power, and to protect themselves in times of global turbulence (Aizenman and Inoue, 2013). However, our analysis of BNM foreign reserves showed that allocation in gold is very negligible, 1% of total international reserves. This study recommends increasing the official gold holdings, to the optimal level or higher, with the aim to build a balanced portfolio which will preserve its value in times of financial distress.
References
Aizenman, J and Lee, J. (2008). Financial versus Monetary Mercantilism: Long- run View of Large International Reserves Hoarding. The World Economy, 31(5), 593-611.
Aizenman, J. and Marion, N. (2003). The High Demand for International Reserves in the Far East: What is Going on? Journal of the Japanese and International Economies, 17(3), 370-400.
Aizenman, J. and Inoue, K. (2013). Central Banks and Gold Puzzles. Journal of the Japanese and International Economies, 28(C), 69-90.
Aizenman, J., Cheung, W. and Ito, H. (2015). International Reserves Before and After the Global Crisis: is There No End to Hoarding? Journal of International Money and Finance, 52(C), 102-126.
Bayram, K. (2017). Identifying the Optimal Level of Gold as a Reserve Asset for Selected OIC Countries (PhD Thesis). IIUM Institute of Islamic Banking and Finance (IIiBF), International Islamic University Malaysia (IIUM).
Black, F. and Litterman, R. (1991). Global Asset Allocation with Equities, Bonds, and Currencies. Fixed Income Research, Goldman, Sachs & Company, October.
Black, F. and Litterman, R. (1992). Global Portfolio Optimization. Financial Analysts Journal, 48, September/October, 28-43.
Ciner, C. (2001). On the Long Run Relationship between Gold and Silver: A Note. Global Finance Journal, 12(2), 299–303.
Davidson, S., Faff, R., and Hiller, D. (2003). Gold Factor Exposures in International Asset Pricing. Journal of International Financial Markets, Institutions and Money. 13(3), 271-289.
Draper, P., Faff, R.W., and Hiller, D. (2006). Do Precious Metals Shine? An Investment Perspective. Financial Analyses Journal, 62(2), 98-106.
ECB. (2006). The Accumulation of Foreign Reserves. Ecb Occasional Paper Series, No. 43, February, 2006.
Egan, P. and Peters, C. (2001). The Performance of Defensive Investments. Journal of Alternative Investments, 4, 49–56.
Eichengreen, B. (1993). Epilogue: Three Perspectives on the Bretton Woods System NBER Chapters. In a Retrospective on the Bretton Woods System: Lessons for International Monetary Reform. National Bureau of Economic Research, Inc. 621-658.
Eichengreen, B. (2004). Global Imbalances and the Lessons of Bretton Woods.
Economie Internationale/International Economics, 100(4), 39-50.
Eichengreen, B. (2011). Exorbitant Privilege: The Rise and Fall of the Dollar and the Future of the International Monetary System. Oxford: Oxford University Press.
Harmston, S. (1998). Gold as a Store of Value. World Gold Council Research, 22.
Idzorek, T. M. (2007). A Step-by-Step Guide to the Black-Litterman Model:
Incorporating User-Specified Confidence Levels. In Forecasting Expected Returns in the Financial Markets. Oxford: Academic Press.
Jaffe, J. (1989). Gold and Gold Stocks as Investment for Institutional Portfolios.
Financial Analysts Journal, 45, 53–59.
Johnson, R. and Soenen, L. (1997). Gold as an Investment Asset—Perspectives from Different Coutries. Journal of Investing, 6, 94–99.
Lucey, B. M., Poti, V. and Tully, E. (2006). International Portfolio Formation, Skewness and the Role of Gold. Frontiers in Finance and Economics 3(1), 1–17.
Markowitz, H. (1952). Portfolio Selection. The Journal of Finance. 7, 77-91.
Melvin, M. and Sultan, J. (1990). South Africa Political Unrest, Oil Prices, and the Time Varying Risk Premium in the Gold Futures Market. Journal of Futures Markets 10, 103–112.
Mohanty, M.S. and Turner, P. (2006). Foreign Exchange Reserve Accumulation in Emerging Markets: What are the Domestic Implications? BIS Quarterly Review, 39-52.
Sherman, E. (1982). Gold: A Conservative, Prudent Diversifier. Journal of Portfolio Management, 8(3), 21-27.
WGC. (2010a). The Evolution in Central Bank Attitudes toward Gold. WGC- HO-GA-002 April 2010.
WGC. (2015b). Gold in a Multicurrency Reserve System. Retrieved from http:// www.gold.org/research/gold-multicurrency-reserve-system
Notes
Claims in US dollars Claims in Pounds sterling Claims in Japanese yen Claims in Euros