
IIUM Institute of Islamic Banking and Finance
Financial Market Risk and Gold Investment in an Emerging
Market: The Case of Turkey
Kamola Bayrama*, Adam Abdullahb, Ahamed Kameel Mydin Meerac
a,b,c IIUM Institute of Islamic Banking and Finance (IIiBF), International Islamic University Malaysia Corresponding author:[email protected]
Abstract
This study aims to identify the opportunity cost of holding gold, in relation to the stock market for case of Turkey. The focus is to detect if gold acts as a safe haven or a hedge asset in times of distress. The Threshold GARCH (TARCH) model was utilized. The analysis used daily data for the period 2005-2014. The data for selling prices of gold was represented by selling prices derived from Precious Metals and Diamonds Markets (PMDM). The returns on Borsa Istanbul (BIS) was employed to represent aggregate prices of stock market investment. It was found that gold has safe haven asset features which shows that gold outperforms the average portfolio during times when stock market faces distress.
Keywords: Turkey, Stock Returns, Gold investment, Gold, Safe haven asset, TARCH model
© 2017 International Islamic University Malaysia
1. Introduction
Investors buy and hold assets with the anticipation of the future returns. Yet, some assets known as hedge assets may have good return during normal times but during times of downturn may follow the general trend due to the high positive correlation with other financial assets. On the other hand, some assets known as safe haven assets may be not appealing to the investor during normal times, but they significantly over perform the market during times of turbulence. Therefore, it is crucial to identify what is the opportunity cost of holding the particular asset in relation to another to build a balanced portfolio which will preserve its value in all states of the market. Gold has shown the feature of safe haven asset and it is especially important during times of financial or geopolitical turbulences (Harmston, 1998). Traditionally gold has played an important role during times of political and economic turmoil and during equity market crises; when gold has responded with higher prices (Koutsotiannis, 1983; Melvin and Sultan, 1990; Cai et al, 2001; Smith, 2002; Lawrence, 2003). Dissimilar to the rest of the financial assets inclusive of sovereign bonds, physical gold does not have counterparty risk (Mylchreest, 2016). However, for years, a common reason of reluctance of western investors in investing in gold was that gold has no yield.
The role gold plays in Turkish society is multidimensional. At an average of 181 tonnes per year over the past decade, Turkey is the world’s fourth largest consumer of gold. WGC 2015, estimates that Turkish households have accumulated at least 3,500 tonnes of “under the pillow” gold. Generations of Turkish savers have turned to gold as an affective hedge against the ravages of inflation and currency weakness. Between 2000 and 2014 the Turkish lira depreciated four-fold against the dollar. In contrast, gold appreciated sixteen-fold in local currency terms. Given the importance of gold for the Turkish consumers this study aims to identify what is the opportunity cost of holding gold in relation to the stock market and to identify how gold acts during times of turbulence in Turkish economy. Does it display the features of a hedge asset or does it behave as a safe haven asset
The study is organised into five sections. The first section provides an introduction to the research. The second section is dedicated to the literature review. The third section presents the methodology, whilst the section four presents findings and discussion. Finally section five provides concluding remarks.
2. Literature Review
Baur and Lucey (2009) presented the evidence of the potential for gold to act as a safe haven asset. According to their findings, gold tends to hold its value when stock markets experience extreme negative returns. Furthermore, in their paper, the authors distinguish between the safe haven and hedge assets. Thus, according to them, a hedge is defined as an asset which is uncorrelated or negatively correlated with another asset or portfolio on average, such as sovereign bonds in normal times, while a safe haven is defined as an asset that is uncorrelated or negatively correlated with another asset or portfolio during the times of market stress or turmoil only.
McCown and Zimmerman (2006) found evidence that gold is an excellent hedge against inflation. Moreover, their findings suggest that gold shows the characteristics of a “zero beta asset”, bearing no market risk. Capie et al. (2005) find evidence of the potential of gold as an exchange-rate hedging instrument. Baur and McDermott (2009) pointed out that the presence of a strong safe haven in the market suggests the potential for gold to act as a stabilizing force for financial markets by reducing losses when it is most needed, i.e. during economic turmoil.
Ibrahim (2012) applied GARCH-type models to study the relationship between the returns on gold and stock returns in Malaysia for the period between 2001 and 2010, and examined how this relationship changes during times of financial instability. His results suggest that the relationship between gold returns and once-lagged stock returns is significantly positive. Furthermore, the author noted that during successive days of market turmoil the relationship was not strengthened, in contrast to the following four successive market decline days where the returns on gold tend to break from the positive correlation with returns on the stock market. On the other hand, during times of financial turmoil, national stock markets display a domino effect. The author suggests that for the emerging market of Malaysia, gold provides a diversification benefit.
3. Methodology
TARCH model was introduced by Glosten, Jagannathan and Runkle (1993). As have been mentioned previously volatility is affected differently by good and bad news. So that, the effect of the negative news is more severe compared to the effect of the positive news. This phenomenon is also known as asymmetric volatility, which characterized by the leverage effect. Leverage effect is asymmetry in volatility brought by large ‘positive’ and large ‘negative’ returns on asset. Asymmetric volatility response could not be captured by symmetrical GARCH models. So that we use asymmetric GARCH models which can describe leverage effects by enabling conditional variance to respond asymmetrically to upswings and drops in volatility returns. The superiority of the TARCH model is that it treats good and bad news symmetrically. The model defines good or positive news as and bad or negative news as . TARCH can catch the occurrence of good news hitting on the market with the market being in a stable period; and the bad news hitting the market when the market is entering turbulent period and high volatility. The model is as follows:
(1) Where:
– the leverage term,
– constant parameters.
is an indicator imitation variable wich defines as follows:
TARCH (p,q) model has p GARCH coefficient associated with lagged variances, q ARCH coefficients associated with lagged squared innovations, and q leverage coefficients associated with the square of negative lagged innovations.
3.1 Augmented Dickey-Fuller (ADF)
ADF is a unit-root test which used to determine if a time series are stationary or not. The null hypothesis states that the series is non-stationary. The model applied to the testing procedure is as follows:
Where:
time series under the analysis,
the first difference,
the lag order of the autoregressive process, and residuals of series.
A natural way to introduce asymmetry is to specify the conditional variance as a function of the positive and negative parts of the past innovations. Recall that and note that . TARCH class of models introduces a threshold effect into the volatility. Our empirical model is specified by implementing an autoregressive distributed lag model as found in Capie et al. (2005) and Ibrahim (2012). Hence we have
Where:
RG – daily gold returns,
RS – daily stock returns, and
Lagged dependent variable is included to consider autocorrelation structure in returns on gold. Since, our presumption suggests that the information transmission among markets, in OIC member countries, may take time, the one lagged stock return is integrated. So that, the fluctuations in stock returns may be impounded with lag into the gold return. The sums of stock market and bond market coefficients, β1 + β2 and β3 + β4 give us the overall reaction of gold returns to changes in stock market and bond market subsequently. So, we decide that gold performs as portfolio diversifier if the sum of stock market coefficients is significantly positive and is far from unity or the model explanatory is close to zero (Hillier et al. 2006). At the same time, if the sum of stock market coefficients is significantly negative or not significant we conclude that gold investment is a hedge against financial market risk (Baur and Lucey, 2009; Baur and McDermott, 2010).
In the implementation of equation (1) we take note of ample evidence that high-frequency asset returns tend to display leptokurtic feature of volatility clustering, known as auto regressive conditional heteroskedasticity (ARCH) effect. In finance literature numbers of error distributions and variance equation definitions have been proposed. The distribution of error is considered to be distributed in relations to either the normal distribution (N), generalized error distribution (G) or, t-distribution (T). The time-varying variance definitions are generalized autoregressive conditional heteroscedasticity (GARCH), threshold autoregressive conditional heteroskedasticity (TARCH), and exponential autoregressive conditional heteroscedasticity (EGARCH). TARCH and EGARCH models take into consideration asymmetric responses of volatility to positive and negative shocks (Ibrahim, 2012). We follow Capie et al.
(2005) and Ibrahim (2012) to prevent unreasonable model selection. Asymmetric volatility specification (TARCH) is used for it was described as the best fit for dynamics of gold returns and also G is used to interpret the error distribution. Our basic model is equation (1).
The analysis includes daily data for the period for 2005- 2014 for Turkey.
The data for selling prices of gold are represented by selling prices derived from, Precious Metals and Diamonds Markets (PMDM). While data from Borsa Istanbul (BIS) employed to represent aggregate prices of stock market investment. All data is sourced from Bloomberg.
4. Findings and Discussion
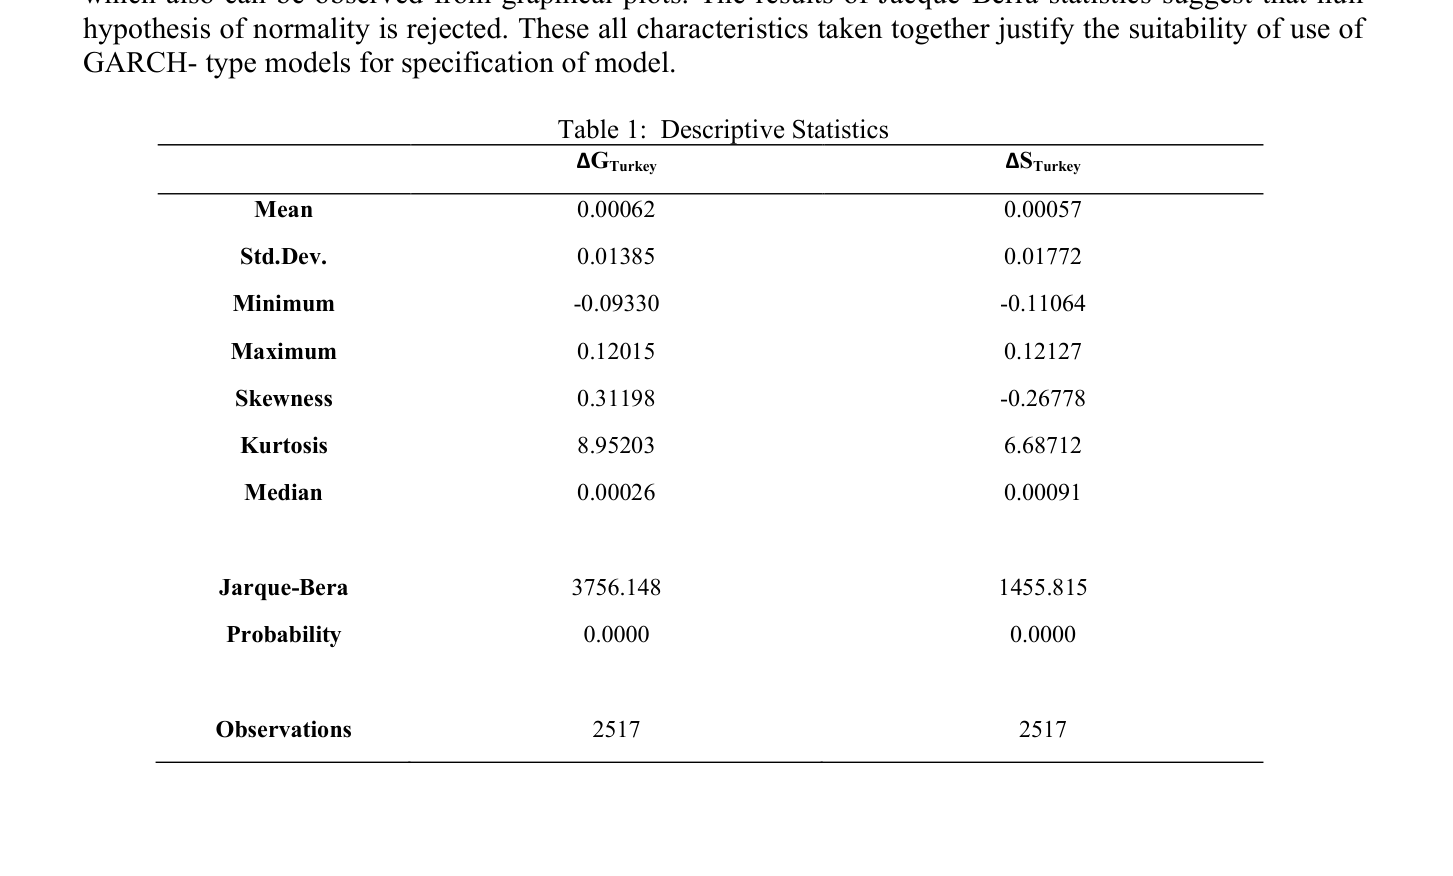
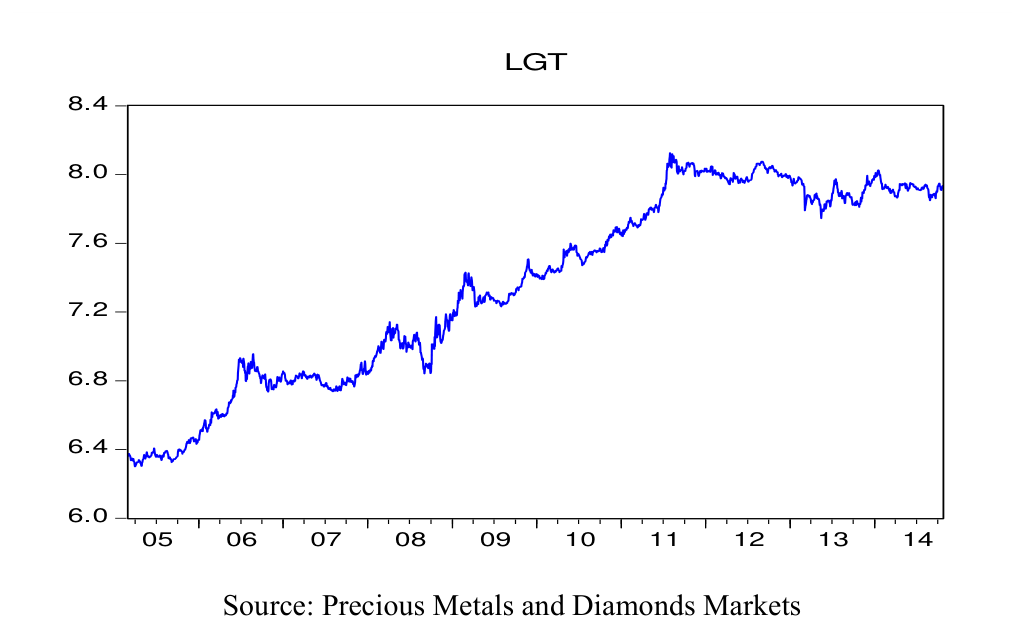
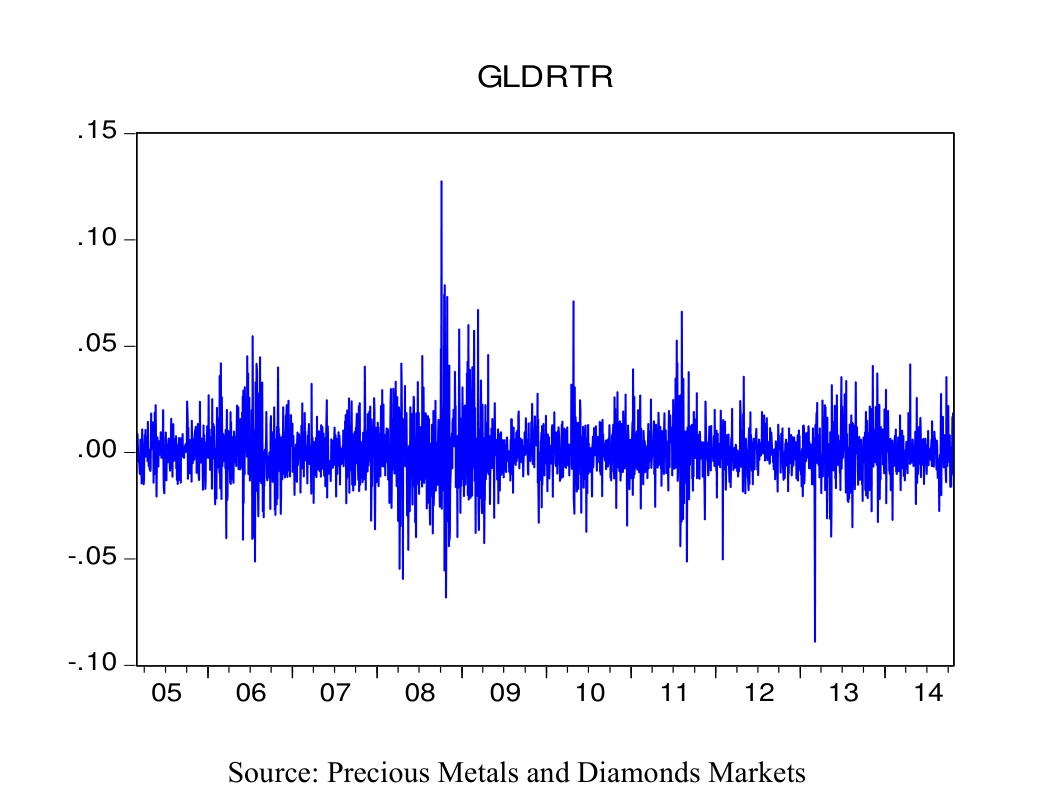
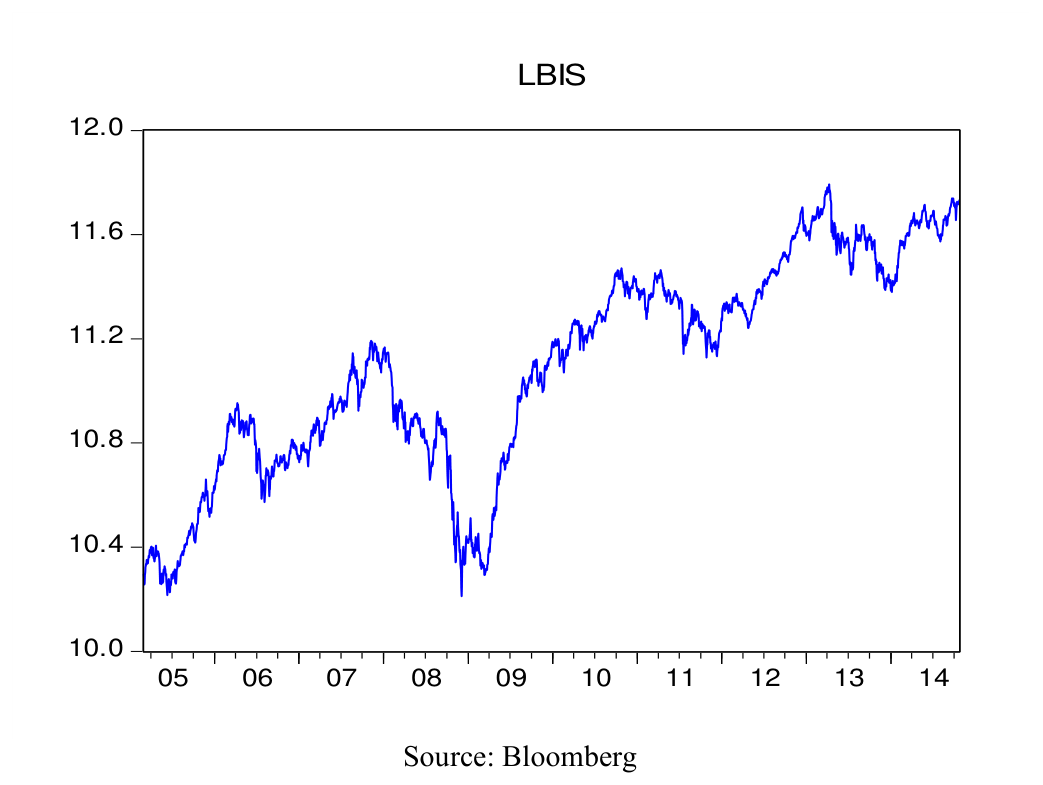
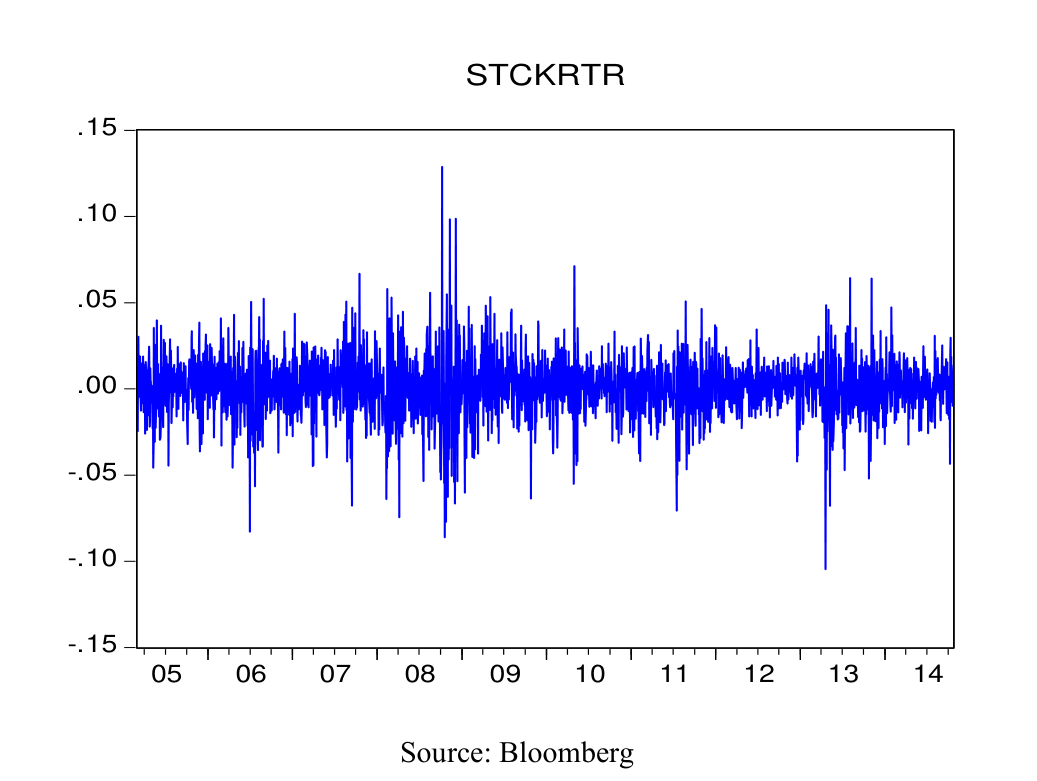
Table 1 provides descriptive statistics of the returns from gold and stock market. Figures 1, 2, 3 and 4 illustrate the natural log of gold prices, returns on gold, natural log of BIS100 Index and stock market returns respectively. Data from Turkey indicates that daily average of gold returns and market returns are same (i.e. = 0.06 per cent). Remarkably, for the Turkish market the returns of stock market are more volatile compared to the volatility of gold returns. The extreme positive returns on gold and stock market are same almost same, being equal to 0.12015 and 0.12127 respectively. However the extreme negative value of stock market (= – 0.11064) is relatively lower than corresponding value for the gold returns (= – 0.09330). From the plots it is also observed that both series experienced an upward trend for the sample period. However, aftermath the GFC there is an evident reduction in stock market returns, whereas, for the same period the returns on gold are positively skewed. Both series are characterized by excess peakedness having kurtosis statistics to be higher than 3. Which suggest that volatility clustering in the return series, which also can be observed from graphical plots. The results of Jacque-Berra statistics suggest that null hypothesis of normality is rejected. These all characteristics taken together justify the suitability of use of GARCH- type models for specification of model.
ΔGTurkey
ΔSTurkey
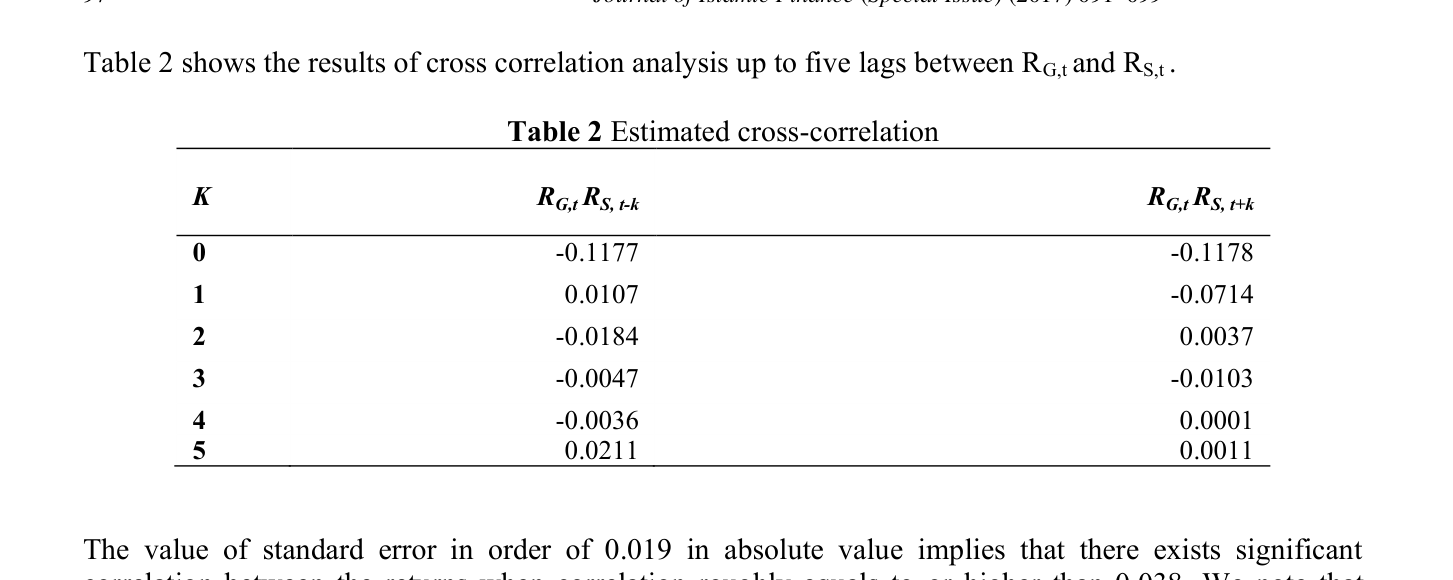
2517 2517 Table 2 shows the results of cross correlation analysis up to five lags between RG,t and RS,t .
RG,t RS, t-k
RG,t RS, t+k
The value of standard error in order of 0.019 in absolute value implies that there exists significant correlation between the returns when correlation roughly equals to or higher than 0.038. We note that correlations between returns on gold and stock (contemporaneous and lagged) are very low and generally negative. There is no significant correlation observed between gold returns and lagged stock market returns, which means that for Turkish economy the gold market does not have a tendency to follow the stock market, on the contrary the stock market follows the gold market. Among all correlations correlation between gold return, current and once lead stock returns is significant, -0.1177 and -0.0714 respectively. Eventually, once-lagged stock return is included into the mean equation. The results of the preliminary analysis suggest that for Turkish economy gold acts as a hedge against the market risk i.e. safe haven asset feature, given that the correlation is significantly negative. We now extend our discussion to support our preliminary results with formal analysis.
4.1 Estimation Results
This section conducts a formal analysis of the return on gold and its relation to stock market as specified in equation (1) using TARCH (1,1) model.
Estimation results of the TARCH (1, 1) model for the basic mean equation are as follows (in parenthesis are given p-values):
N = 2,514, GED Parameter = 1.2539 (0.000), Log Likelihood = 7,633.577
Where It =1 if εt < 0 and 0 otherwise. Implementation of TARCH model implies that previous shocks have asymmetric effect on volatility. The negative coefficient of shows that bad news (εt > 0) effect the market volatility negatively. That is, the effect of once-lagged positive news (εt-1 > 0) on volatility of gold is greater than effect negative news. Besides, gold return volatility tends to be exceedingly persistent as proposed by large coefficient of lagged volatility. The results of our main equation suggest that for case of Turkey current and once-lead stock returns are significant. This also conforms to the correlation structure observed from Table 2 The results suggest that 10 percentage point reduction in gold returns is associated the increase in stock return 0.13 percentage point on time t and 0.07 percentage point increase on time t+1.
In the methodology section we have discussed that the sum of stock market coefficients, β1 + β2, gives us the overall reaction of gold returns to changes in stock market. According to our result the sum of stock market coefficients equals to -0.1915, which means that for the Turkish economy gold carries the characteristics of safe haven asset.
5. Conclusion
The research findings suggest that gold has a safe haven asset feature for the Turkish economy. In case of Turkey the returns on gold are less volatile compared to the market returns. No significant correlation between gold market and stock market was detected which shows that in case of Turkey the gold market does not follow but leads the stock market. The estimation results derived from TARCH (1,1) suggest that for the Turkish economy gold holds the features of a safe haven asset. Therefore, including gold into the portfolio shall hedge it against the market risk.
Acknowledgment
This study is supported by International Islamic University Malaysia (IIUM) grant EDW B 14-191-1076.
References
Baur, D. & Lucey, B.M. (2009). Flights and contagion – An empirical analyses of stock-bond correlations. Journal of Financial Stability, 5(4), 339-352.
Baur, D. & McDermott, T. (2010). Is gold a safe haven? International evidence. Journal of Banking and Finance, 34(8), 1886-1898.
Cai, J., Cheung, Y.-L., & Wong, M.C.S. (2001). What moves the gold market? Journal of Futures Markets, 21, 257–278.
Capie, F., Mills, T. C., & Wood, G. (2005). Gold as a hedge against the dollar. Journal of International Financial Markets, Institutions and Money, 15(4), 339-352.
Glosten, L. R., Jagannathan, R. & Runkle, D. E. (1993). On the relation between the expected value and the volatility of the normal excess return on stocks. The Journal of Finance, 48(5), 1779-1801.
Harmston, S. (1998). Gold as a Store of Value. World Gold Council Research, 22.
Hillier, D., Draper, P., & Faff, R. (2006). Do precious metals shine? An investment perspective. Financial Analysts Journal, 62(2), 98-106.
Ibrahim, M. (2012). Financial market risk and gold investment in an emerging market: the case of Malaysia. International Journal of Islamic and Middle Eastern Finance and Management, 5(1), 25 – 34.
Koutsoyiannis, A. (1983). A short-run pricing model of a speculative asset tested with data from the gold bullion market. Journal of Applied Economics, 15, 563–582.
Lawrence, C. (2003). Why is Gold Different from Other Assets? An Empirical Investigation. London:
World Gold Council.
McCown, J. R. & Zimmerman, J. R. (2006). Is Gold a Zero-Beta Asset? Analysis of the Investment Potential of Precious Metals. Retrieved from: http://ssrn.com/abstract=920496 orhttp://dx.doi.org/10.2139/ssrn.920496.
Melvin, M. & Sultan, J. (1990). South Africa political unrest, oil prices, and the time varying risk premium in the gold futures market. Journal of Futures Markets, 10, 103–112.
Mylchreest, P. (2016). Death of the Gold Market: Reforming the LBMA and the true price of physical gold. Equity & Cross Asset Strategy. Retrieved from http://www.gata.org/files/MylchreestReport-05-2016.pdf.
Smith, G. (2002). London Gold Prices and Stock Prices in Europe and Japan. London: World Gold Council.
WGC (2015). Turkey: Gold in action. World Gold Council, 22 CR. Retrieved from:
http://www.gold.org/supply-and-demand/turkey-gold-in-action.